Predictive Scenario On Classification.
Smart Predict is an Augmented Analytics feature in SAP Analytics Cloud that helps you generate predictions about future events, values, and trends.
The predictive experience in SAP Analytics Cloud is simple. Smart Predict guides you step by step to create a predictive model based on historical data. The resulting model can be used to make trusted future predictions, providing you with advanced insights to guide decision-making.
Smart Predict accelerates the prediction and recommendation creation process by focusing on business outcomes.
Before using Smart Predict for the first time, it really helps to understand a few basic concepts of predictive modeling. So, here they are!
The different types of predictive scenarios
There are currently 3 types of predictive scenarios available in Smart Predict:
- Classification
- Regression
- Time Series
Defining the business problem or business question you want to address will help you choose the right type of predictive scenario.
Classification Scenario: If you’re trying to determine the likelihood of whether something will happen, you’re dealing with a classification scenario.
Ex: You want to predict membership of categories such as Yes/NO, Customer is likely to churn or not, replacing intervals within short or long for the manufacturing process, Binary (0 or 1).
Regression Scenario: If you’re trying to predict a numerical value and explore the key drivers behind it, you’re dealing with a regression scenario.
Ex: Predict the price of an imported product based on projected transport charges and tax duties.
Time Series Scenario: If you’re trying to forecast a future numerical value based on fluctuations over time, seasons, and other internal and external variables, you’re dealing with a time series scenario.
Predictive Scenario based on Regression:
Step 1. Loading the data
• Before we load the dataset into SAC, we cut out a few records from the original dataset. We will use this to apply our model later. I cut out 20 records of each wines from the dataset for red and white wines, each to use later. Now I have 4 datasets as follows.
A. 1580 red wines for training
B. 20 red wines for prediction
C. 4879 white wines for training
D. 20 white wines for prediction
At first create a folder in your files to save all the files at one place.
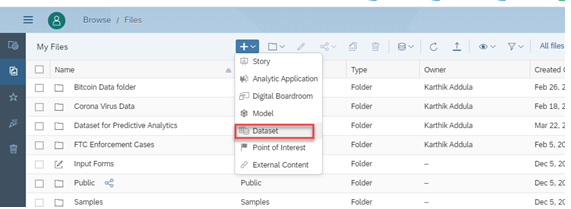
Inside your newly created folder, create a new dataset by clicking ‘+’ icon → Dataset .
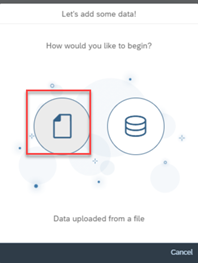
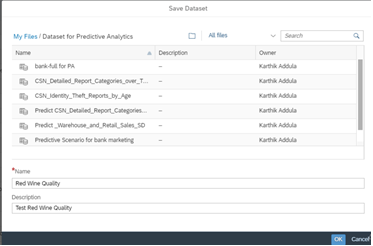
Now you will be asked how you would like to begin – load data from a local file or from a data source. Since we have data in csv files, click on local data source. Select your source file. Load all 4 datasets. Your folder should look like the last screenshot.

Step 2. Training the model
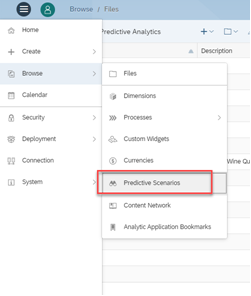
- Let us now build the predictive scenario. This is where our models to predict wine quality will be built and trained. On the main menu, click on Create >> Predictive Scenario.
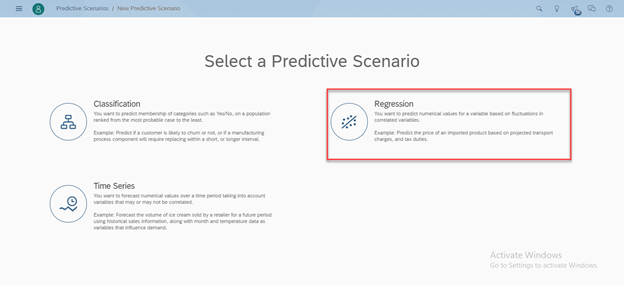
- For this problem, our predicted entity is an integer between 0 to 10. So, we will build a regression model. Select regression, give the scenario a suitable name and description.
In the Predictive Scenarios page click on ‘+’ to add a scenario.

Select a scenario that best suits to your analytic dataset.
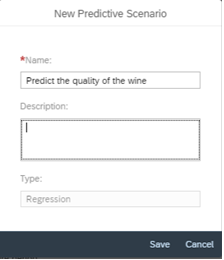
Fill the details and click on OK.
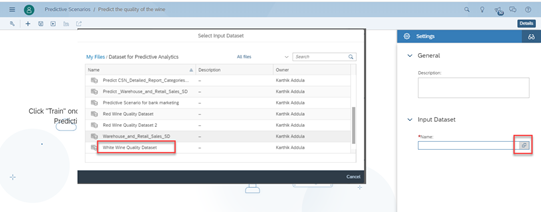
Select the Input Dataset as show below.
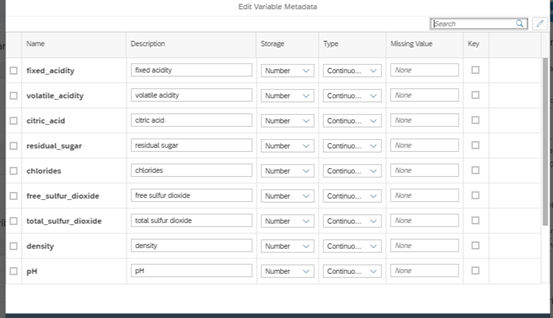
- If you want edit the edit metadata, Click on Edit variable metadata (under the input dataset field) to understand how SAC has interpreted the dataset, what is the storage and type of each of the variables, what should SAC do with missing values, is the variable the key of the dataset, etc.
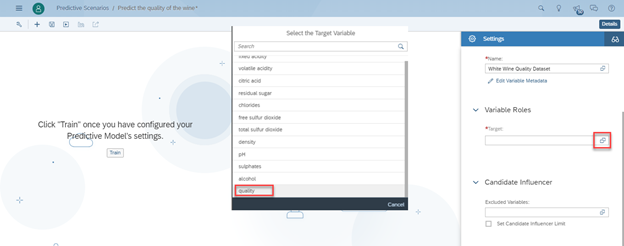
- We now need to define the variable we wish to predict. In our case this is quality of the wine, so click on Target and select quality.
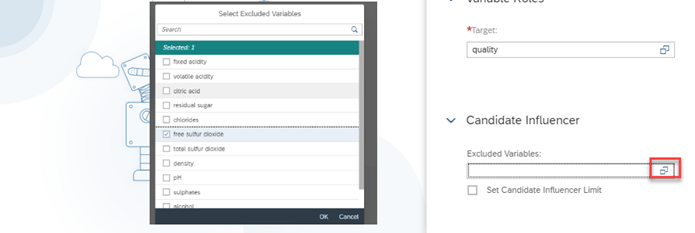
- If there are variables in the dataset, you would like to exclude from modelling, declare them here as show below. This helps to Improve the results.
- Now that SAC knows what it needs to do, we can get started with training. Click on Train at the bottom.
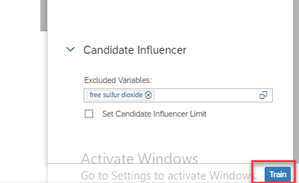
SAC will take a while to train with the data set, and identify the best model for this problem statement. Then you now have results of your model as shown below.
Step 3. Understanding the results
- After you click on Train, and SAC completes the training process, it will show you 2 tabs of information.
- Overview tells you about the quality of the results
- In our cases it is 99% confident about its results.
- It also says that the error is 0.8. This means that the true value is ±0.8 from our prediction.
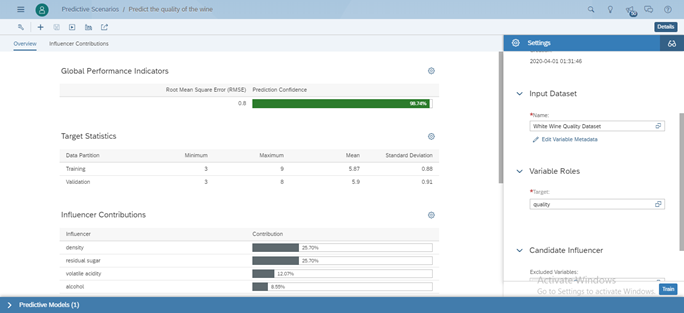
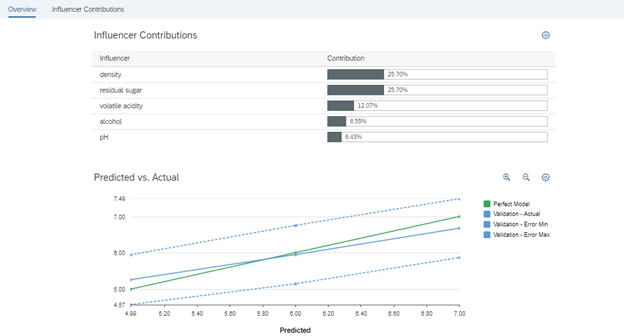
- The influencer contributions explain the results
- Density of the wine and sugar understandably have the highest correlation with wine quality, followed by the other variables.
Step 4. Applying the model
- Now that our model is ready, we can apply it on the dataset we had carved out earlier.
- Click on the apply model option (icon at far right).

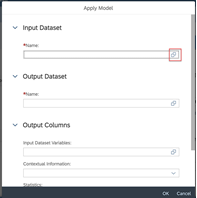
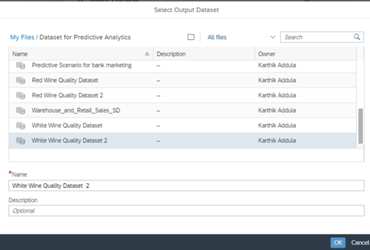
- At Input Dataset Variables selects the variables that you would like to see in the output.
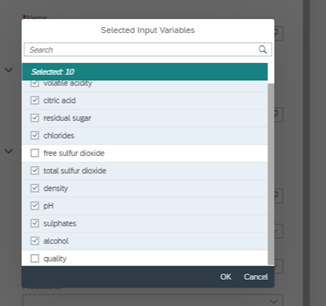
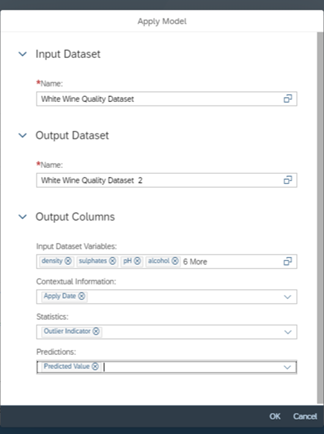
- Fill all the details as shown below and click on Ok.
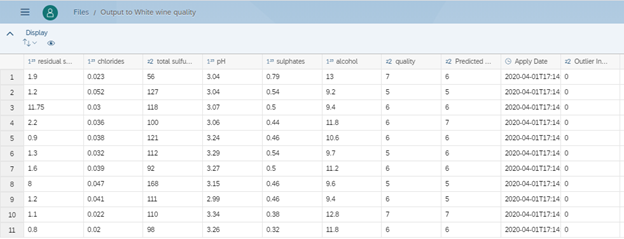
- Then go to the folder to check the predicted model and click on the model. You can see, in the predictions file, see the column at far right called Predicted Value.
Repeat the same steps to know the quality of the Red wine.
- I found the model for red wines had an error of 0.69 with a confidence of 95%. Alcohol seems to be the dominant predictor.
- I can see both my models in the predictive model’s section at the bottom. I can see status of models (trained / applied).

Create a model based on the Output Dataset of the Predictive Scenario.
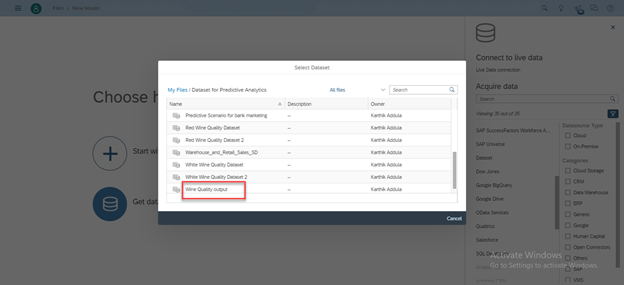
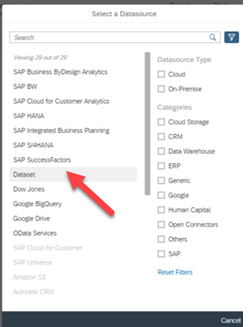
Click on Menu → Create→ Model→ Click on Get data from datasource and in the Acquire Data select Dataset.
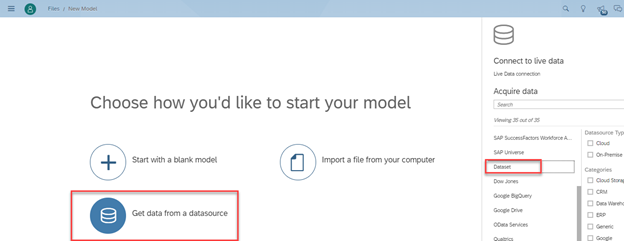
- Select the Dataset.
- Click on the Create Model on the bottom.
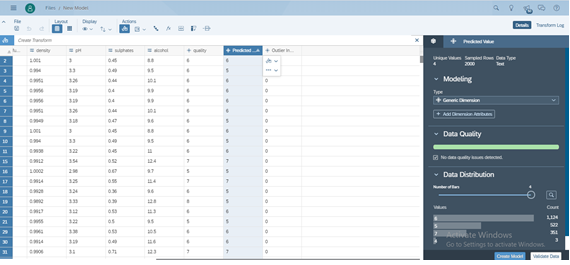
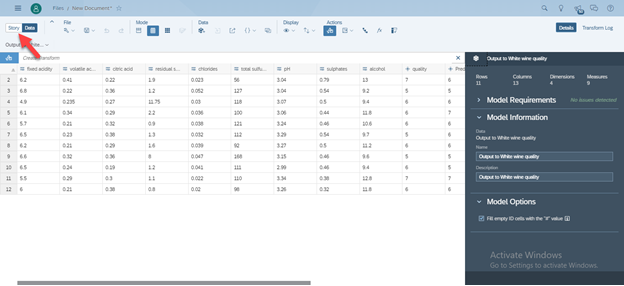
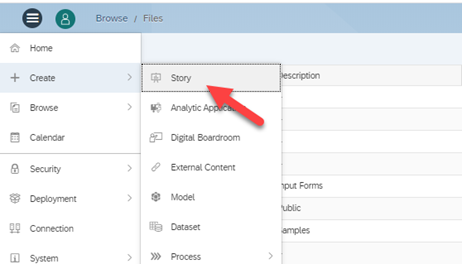
Or You Can directly create a story on Dataset.
Go to Create → Click on Story
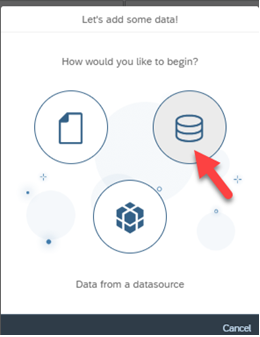
- Click on Access & Explore Data as shown below.
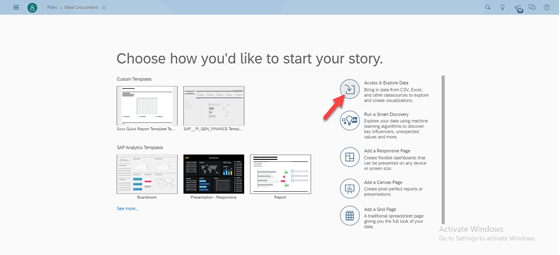
- Click on Datasource and click on the Dataset as shown below.
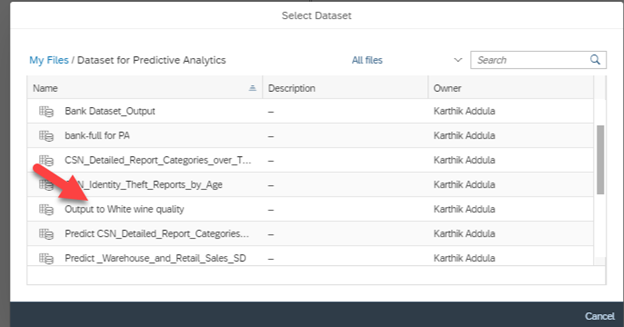
- Select the Dataset.
- Click on the Story and start creating story.
