
Demystifying SAP Business Data Cloud
SAP Business Data Cloud (BDC) brings together data, analytics, and planning into one powerful platform.
It helps businesses make smarter decisions by unifying insights across SAP and non-SAP systems.


SAP Business Data Cloud (BDC) brings together data, analytics, and planning into one powerful platform.
It helps businesses make smarter decisions by unifying insights across SAP and non-SAP systems.

I’ve been doing some research lately—talking to teams, reading up on AI use cases, and honestly just observing what’s working (and what’s not) in real-world scenarios.
There’s a pattern I keep seeing.
Everyone’s excited about AI. Companies are investing in platforms, training models, and talking a lot about what’s possible. But when it comes time to use AI to solve real problems?
They hit a wall.
And often, that wall is data silos.
Data silos happen when information is scattered across tools, teams, or platforms—and no one’s sharing. It might not seem like a big deal at first. After all, each team knows their data, right?
But when your sales, finance, marketing, and ops data are living in separate worlds, disconnected and unaligned, your AI doesn’t stand a chance.
Even if your organization has all the right inputs, it’s like trying to build a puzzle with pieces from different sets.
AI isn’t magic. It needs clean, consistent, and connected data to work well.
When your data is fragmented:
Silos make it nearly impossible for AI to see the full picture. And when that happens, trust in AI outcomes erodes quickly across the organization.
Here’s the good news: solving this doesn’t mean ripping out your current systems.
The smarter approach is to build a unified data layer—a way to connect your existing sources without forcing everything into one giant warehouse. Tools like SAP Business Data Cloud do exactly this. They let your data stay where it is, but make it visible, governable, and usable across functions.
This kind of setup means your AI can finally pull from the full context—not just fragments.
Tech alone doesn’t fix the problem. You need clarity on who owns what data, how it’s maintained, and how it’s defined.
Something as simple as the word “customer” can mean five different things across teams—and that kind of inconsistency can throw off everything from sales forecasting to churn prediction.
Building shared definitions and clear ownership ensures your AI models are working with reality, not assumptions.
AI can’t sit on the sidelines. To create impact, it needs to be embedded directly into your workflows—supporting things like planning, demand forecasting, pricing, or customer retention.
This shift from AI as an experiment to AI as a core part of business operations is where real ROI begins to show up.
Most companies already have plenty of data. But it’s not about volume—it’s about how that data connects and flows.
That’s the real unlock for AI.
When your data is silo-free, your AI can move faster, learn faster, and deliver smarter insights that drive results.
At Tek Analytics, we help businesses go from siloed and stuck to smart and scalable—using data platforms that are built for AI success.
If your team is exploring how to make your data AI-ready, let’s have a conversation.
Because the best AI strategy? Starts with the right data foundation.

Let’s face it—we’re living in a world where AI isn’t just a sci-fi buzzword anymore. It’s real, it’s here, and it’s already changing how businesses operate—fast.
And at the heart of this shift? Generative AI (or GenAI, as we like to call it).
But what *is* it really? And more importantly—why should your organization care?
GenAI is a type of artificial intelligence that doesn’t just analyze data—it *creates*. We’re talking text, images, code, video, audio, even 3D models. It’s the engine behind tools like ChatGPT, DALL·E, GitHub Copilot, and more.
Instead of just answering questions, GenAI collaborates. It learns from massive datasets and responds in human-like ways—drafting emails, summarizing reports, writing code, and generating ideas that honestly feel… creative.
In short? GenAI is a productivity booster that helps people get more done—faster, smarter, and with more impact.
Because GenAI isn’t just another tech trend. It’s a fundamental business shift. And if your competitors aren’t already testing it out… they will be soon.
Here’s what GenAI is bringing to the table:
1. Things Get Done—Way Faster GenAI cuts hours off repetitive tasks. Instead of manually formatting that 20-page report? Let AI do the heavy lifting, so your team can focus on the good stuff—like strategy and innovation.
2. Creativity Gets a Major Upgrade Need a dozen ad copy variations? Personalized emails for different customer segments? A fresh product description that actually stands out?
Done, done, and done. GenAI acts like a creative partner—not a replacement—but a powerful one.
3. Personalization at Scale This is where GenAI really shines. It helps you deliver customized experiences to thousands of people—without losing the human touch. Smarter bots, adaptive learning, AI-curated recommendations… even at enterprise scale, your users will feel like you’re speaking directly to them.
Still feels a bit abstract? Let’s talk about what this looks like in the real world:
This isn’t “someday” stuff. It’s happening *right now*—and it’s working.
With great power comes—yep, you guessed it—responsibility.
GenAI is powerful, but it needs strong governance. Ethics, bias monitoring, data privacy, transparency… these aren’t optional. They’re essential for building trust and staying compliant.
That’s why leading orgs are investing in AI Centers of Excellence, building responsible AI frameworks, and upskilling their teams to lead the charge.
GenAI isn’t a passing trend. It’s a tectonic shift in how work gets done.
Organizations that start exploring now will shape the future. The ones that wait? They’ll be catching up in a world that’s already moved on.
Whether you’re just curious or ready to scale, now’s the time to start asking the big questions about how GenAI can support your business.
Because the real question isn’t *if* you’ll use GenAI… it’s *how soon* you’ll make it work for you.

Curious about SAP’s Business Data Cloud announcement and what might it mean to you? We were curious too! We dove in a bit and thought we’d share our initial observations with you.
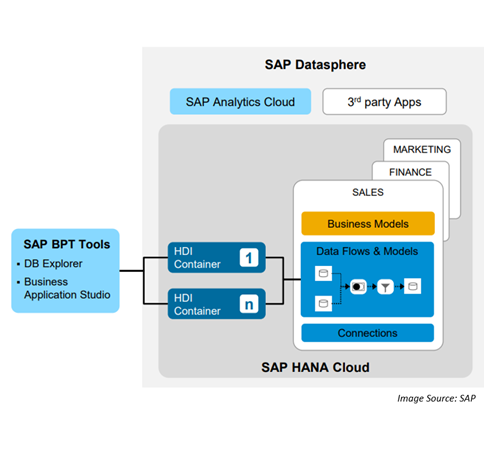
In case you missed the announcement, Business Data Cloud (BDC) is a new SaaS offering from SAP. It unifies analytics, data management, and AI-driven automation into a single integrated solution. In short it pulls together existing SAP products that are data focused into this new offering. This product leverages Datasphere for comprehensive data warehousing, SAP Analytics Cloud (SAC) for planning and analytics, and integrates Databricks to enhance machine learning (ML) and artificial intelligence (AI) use cases—all while preserving business context.
At a high level, the following diagram illustrates the overall high-level conceptual architecture.
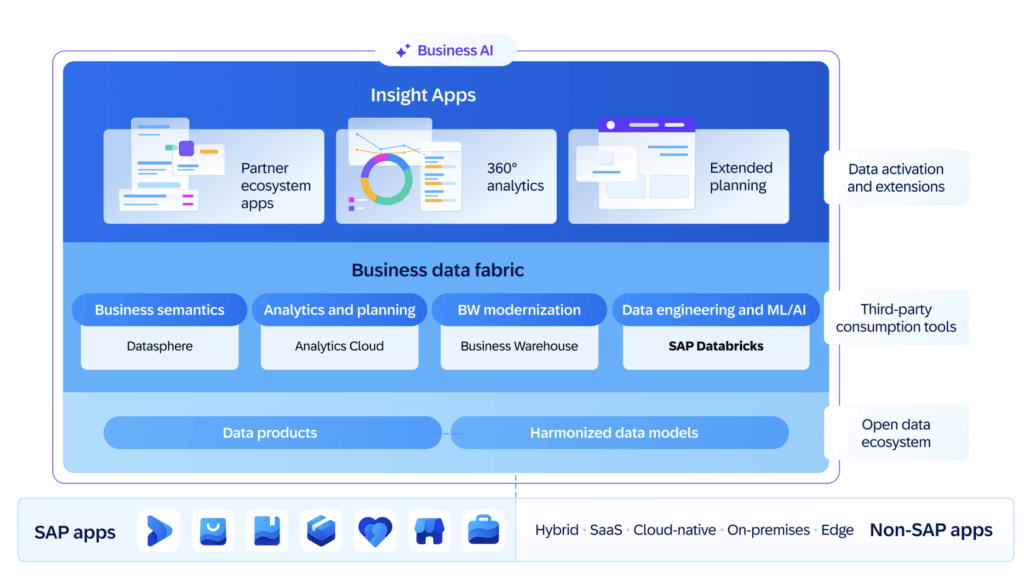
Our initial observations about BDC can be categorized into three buckets: the impact on your data, new opportunities that BDC provides, and the impact to existing Datasphere customers.
Impact on SAP Customers’ Data
One of the biggest challenges SAP customers face today is the need to copy business data into data lakes, a lakehouse, or other cost-effective storage solutions to support ML, AI, and other advanced analytics. This data movement often leads to:
With Business Data Cloud and Databricks integration, customers can now access and process their data directly within the SAP ecosystem without extracting it, ensuring:
New Opportunities
What It Means for Existing Datasphere and SAC Customers
Conclusion
From our initial look, Business Data Cloud holds the promise of eliminating the complexity of data movement, making AI, ML, and analytics more efficient and business context aware. By integrating Datasphere, SAC, and Databricks, SAP has created a robust ecosystem that enables advanced data-driven decision-making while maintaining seamless connectivity and performance.


Hey!
Srinija here—I’m part of the team at Tek Analytics. Lately, I’ve been diving deep into Generative AI—reading up, watching demos, and, honestly, the coolest part? Seeing it come to life in the work we’re doing with our clients. Between helping businesses get started and watching my team work their magic, I’ve learned a lot.
It’s everywhere right now, right? Feels like everyone’s talking about how AI is going to change business forever. And from what I’ve seen—it’s not just talk.
And honestly? It’s true. AI is changing the game. I’ve seen it firsthand.
But… (and this is a big but), getting AI to work in your business? That part’s not always so simple.
I’ve had many conversations where people tell me:
“Srinija, we know we need AI, but we don’t know where to start.”
Or, “We tried a small AI project, and it kind of worked… but now what?”
And, of course, “How do we make sure we don’t screw up the security or break some compliance rule?”
If any of this sounds familiar—you are not alone. I see it all the time.
From everything I’ve read, watched, and experienced through my work, I’ve noticed that most businesses run into the same roadblocks when it comes to AI.
The first is just figuring out what to do with it.
AI is this big, exciting thing, and everyone’s talking about it. But when it’s time to apply it to your business, you can get stuck. It’s like, “Okay, cool… but what problem is AI actually going to solve for us?” I’ve seen companies go all-in on AI tools without a plan, and they end up frustrated because it didn’t really make a difference.
Then, there’s the part where you try AI in one area, and it works… kind of.
Maybe you automate a task here or streamline a process there. It’s great—but it’s just that one thing. I’ve seen businesses get stuck in this “pilot phase” where AI is only helping in one corner of the company. They want to scale it up, but connecting AI to all their systems—especially the older ones—feels like trying to mix oil and water.
And honestly? Data and security worries are huge.
This one comes up in every single meeting. “How do we protect our data? What if we accidentally share something sensitive? Are we even allowed to do this under our industry rules?” I’ve seen businesses hesitate to move forward with AI just because they’re nervous about getting it wrong—and I don’t blame them.
This is exactly why, at Tek Analytics, we’ve built a way to help businesses get AI working—without the confusion or guesswork.
We don’t just throw some AI tools at you and say, “Good luck!” We collaborate with you, side by side.
The first thing we always do is sit down and talk—really talk. We call it our AI Innovation Clinic, but honestly, it’s more like a brainstorming session. We dig into what’s working in your business, what’s not, and where AI can help. I’ve had so many of those “Oh, we didn’t even think of that!” moments in these chats.
Once we know what’s right for you, we help you get started—properly.
I’ve seen businesses rush into AI, skip the basics, and hit roadblocks later. That’s why we created AI Jump Start—to set up secure, compliant AI solutions that work with your team and systems, from day one.
And when you’re ready to scale? We’ve got you.
With AI Elevate, we help you move from a few small wins to AI powering your business. We will automate more, fine-tune your models, and make sure AI is driving real, long-term value—without the headaches.
Oh, and this is the part we’re really excited about—we’ve just launched our Rapid Deployment Solutions!
Sometimes you need AI up and running fast. We get that. These solutions are designed to get you started quickly, so you can see results in weeks—not months—without cutting corners on security or quality. We have already seen how much of a game-changer this can be, and I can’t wait to see what it does for more businesses like yours.
One thing I’ve noticed that really sets us apart at Tek Analytics is that we don’t do this cookie-cutter, one-size-fits-all AI stuff.
Every business is different, and we get that. We make sure whatever AI solution we’re helping you with fits into your business, with your people, and your systems.
Plus—this is a big one—we take governance and security seriously. We’re not just excited about AI; we’re also the people making sure you’re staying compliant and not putting your data at risk.
I’ve seen businesses underestimate this part, and it can cause major headaches later. We make sure you don’t have to worry about that.
So yeah, AI can be overwhelming—I get it. But it doesn’t have to be.
With the right approach (and the right partner), it can be pretty smooth—and, honestly, kind of exciting.
If you’re curious, or even if you’re just feeling stuck and want to bounce around some ideas, let’s talk. I’m always happy to share what I’ve seen work.
And if you want to check out more about how we help businesses with Generative AI, here’s the link:
Tek Analytics Generative AI Services

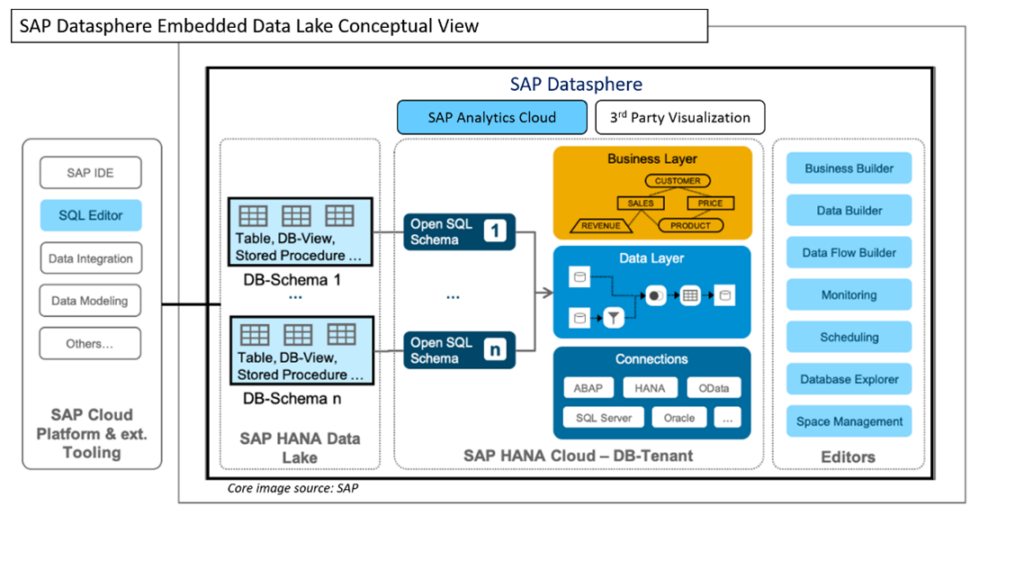
From my vantage points, I have the privilege of observing organizations at varying points in their journey to data insights. And for SAP customers who have been waiting for the right moment for SAP Datasphere, there is now a focus on starting the journey.
Today, I’d like to share a bit about the journey of a supply chain management and logistics solutions provider who went all in on modernizing their SAP BI solutions.
When we first started together, they were an SAP ECC shop with an on-premises, legacy BW data warehouse solution with over 500 BEX queries. Users were sourcing data from a variety of systems for reporting and decision making. On the front end, SAP Business Objects and Tableau were in the mix. This is certainly a very common scenario.
With their legacy BI solution, the organization was facing some common challenges. They were struggling to achieve the necessary speed and cost-effective storage needed for their operations. Additionally, the lack of integration resulted in the loss of SAP context for data stored in third-party databases, further complicating their data management efforts.
To overcome the challenges, together we came up with a strategy and plan to seize-the-moment with an upcoming S/4 implementation. Rather than rework the legacy BI solutions to fit S/4 into the picture, the team took the opportunity to replace the existing BI solution with an all-in move to SAP Datasphere. To mitigate risk, a “joint success plan” was put into place which laid out a phased migration (with a pilot) approach. This allowed the team to work in an agile fashion, apply learnings along the way, and reap some business benefits along the way.
This all involved fully implementing a 3-tier Datasphere landscape, along with BW bridge. To be honest, we learned a few things about BW bridge (and its limitations) along the way! The data and data flows were fully migrated from BW to Datasphere in a manner that allowed us to take advantage of the work previously done in BW (why reinvent the wheel?). Security was fully integrated into the new solution. The queries for the front end were updated to the new solution. And a data lake solution was put into place for cost-effective data storage.
At the end of the day, the outcome was a solution that provided:
Ready to move your data strategy forward and unlock the potential of SAP Datasphere? This client success story is just one example of how we help businesses modernize their data architectures, streamline operations, and drive faster decision-making.
Let us help you achieve the same success! Contact us today to discuss how we can support your migration to SAP Datasphere. Contact TEK – Tek Digital Transformations

Please complete the form to access the whitepaper:

Please complete the form to access the whitepaper:

Please complete the form to access the whitepaper: