An Initial Take: SAP Business Data Cloud

An Initial Take: SAP Business Data Cloud

Curious about SAP’s Business Data Cloud announcement and what might it mean to you?  We were curious too!  We dove in a bit and thought we’d share our initial observations with you. 

In case you missed the announcement, Business Data Cloud (BDC) is a new SaaS offering from SAP.  It unifies analytics, data management, and AI-driven automation into a single integrated solution.  In short it pulls together existing SAP products that are data focused into this new offering.   This product leverages Datasphere for comprehensive data warehousing, SAP Analytics Cloud (SAC) for planning and analytics, and integrates Databricks to enhance machine learning (ML) and artificial intelligence (AI) use cases—all while preserving business context.

At a high level, the following diagram illustrates the overall high-level conceptual architecture.

Our initial observations about BDC can be categorized into three buckets: the impact on your data, new opportunities that BDC provides, and the impact to existing Datasphere customers.

Impact on SAP Customers’ Data

One of the biggest challenges SAP customers face today is the need to copy business data into data lakes, a lakehouse, or other cost-effective storage solutions to support ML, AI, and other advanced analytics. This data movement often leads to:

  • Loss of business context, making it difficult to interpret data correctly.
  • Performance degradation of core SAP applications.

With Business Data Cloud and Databricks integration, customers can now access and process their data directly within the SAP ecosystem without extracting it, ensuring:

  • Seamless AI/ML capabilities within SAP without data duplication.
  • Optimized performance of SAP applications.
  • Preservation of business context, allowing accurate and relevant insights.

New Opportunities

  • Customers using SAC for planning can now integrate with Databricks and Data Builder for more advanced analytics.
  • Script logics for planning that were previously handled within SAC can now be processed in Data Builder, improving efficiency.
  • Predictive modeling and ML-based forecasts on planning data can be executed seamlessly within Databricks while remaining connected to SAP.

What It Means for Existing Datasphere and SAC Customers

  • Datasphere remains foundational and is not being replaced.
  • Existing customers can continue using Datasphere and SAC without disruption.
  • SAP has committed to a smooth transition plan for customers migrating to Business Data Cloud.
  • The migration is expected to be technical in nature rather than a complete overhaul, ensuring that no existing functionalities are lost.

Conclusion

From our initial look, Business Data Cloud holds the promise of eliminating the complexity of data movement, making AI, ML, and analytics more efficient and business context aware. By integrating Datasphere, SAC, and Databricks, SAP has created a robust ecosystem that enables advanced data-driven decision-making while maintaining seamless connectivity and performance.

Contact us

Leveraging SAP Analytics Cloud for Tariff Impact Analysis in the Automotive Industry

Leveraging SAP Analytics Cloud for Tariff Impact Analysis in the Automotive Industry

In today’s volatile global trade environment, automotive companies are facing the challenge of managing and predicting the impact of tariffs on their operations. There are immediate questions to be answered, such as, what impact will there be to the bottom line if we don’t pass this on to the consumer? What is the projected impact to demand if we do? Along with other questions, such as, what happens if we move the manufacturing or assembly of this product to a different location? With legacy planning methods such as spreadsheets or other manual approaches, this quickly becomes an overwhelming, slow, and potentially error prone exercise. Certainly, not an approach that creates analysis timely enough to keep up with the changing external forces. At Tek, we have been delivering planning solutions to leaders in the automotive industry for a while now. We have seen first-hand how an industry leading solution in planning and analytics (SAP Analytics Cloud) can provide the perfect tool for organizations to leverage in times like these. This article explores how SAP Analytics Cloud’s (SAC) advanced planning functionality can help automotive organizations conduct sophisticated what-if scenario analyses to model and prepare for various tariff scenarios, enabling more informed strategic decision-making and an optimized response to the situation.


The Tariff Challenge in the Automotive Industry

As you are probably aware, the automotive industry is experiencing significant disruption due to evolving trade policies and tariff implementations. Recent developments have shown that tariffs may substantially impact on the industry. We have seen estimates indicating that a 25% tariff on imported vehicles and parts could increase vehicle prices by $3,500 to $12,000 per unit. These changes have far-reaching implications across the entire automotive value chain, affecting everything from supply chain decisions to pricing strategies, incentive plans, and market competitiveness. The complexity of automotive supply chains, where components often cross borders multiple times before final assembly, makes tariff impact analysis particularly challenging. (Perhaps not quite as challenging as predicting the impact of a major volcanic eruption on distant locales, but close!) This complexity necessitates sophisticated planning tools that can model multiple scenarios and provide actionable insights for strategic decision-making.


A Comprehensive Solution for Tariff Impact Analysis

The nice thing about SAP Analytics Cloud (SAC), is it is a bit of a one stop shop in situations like this! It offers a unified platform that combines planning, analysis, and predictive capabilities, making it ideal for companies seeking to understand and prepare for tariff impacts. The platform’s integration capabilities allow organizations to connect various data sources, providing a comprehensive view of their operations and enabling more accurate scenario modeling.

Advanced Scenario Modeling Features

The driver-based planning functionality in SAC enables automotive companies to model scenarios based on key business drivers, including raw material costs, component pricing, labor costs, and transportation expenses. This allows organizations to understand how changes in these variables affect their overall business performance and financial outcomes. Robust what-if analysis features empower users to simulate different tariff scenarios and their impact on costs, while simultaneously modeling supply chain alternatives to minimize tariff exposure. Organizations can analyze potential market responses to price adjustments and evaluate the financial implications of relocating production or assembly facilities, all within a single integrated environment.

Real-Time Data Integration and Analysis

SAC’s ability to provide real-time data access and analysis ensures that scenario modeling is based on the most current information available. This capability is particularly valuable in the rapidly changing trade environment, where tariff policies can shift quickly and require immediate response planning. The integration with various data sources enables automotive companies to maintain a comprehensive view of their operations and make data-driven decisions with confidence.


Practical Applications for Automotive Companies

Strategic Planning and Risk Management: Automotive companies utilizing SAP SAC can develop comprehensive tariff impact scenarios while identifying potential risks and opportunities. The platform enables organizations to create detailed contingency plans for various tariff implementations, optimize their supply chain configurations, and model alternative sourcing strategies. This comprehensive approach to strategic planning ensures that companies are well-prepared for various tariff scenarios.

Financial Impact Analysis: The platform facilitates detailed financial modeling of tariff impacts through comprehensive cost structure analysis, margin impact assessment, and revenue forecasting under different scenarios. Organizations can model price elasticity and project working capital requirements, providing a complete picture of the financial implications of various tariff scenarios.


Conclusion

In an era of increasing trade complexity and tariff uncertainty, SAC provides automotive companies with the tools needed to model, analyze, and prepare for various tariff scenarios. The platform’s combination of real-time data access, sophisticated scenario modeling, and integrated planning capabilities makes it an essential tool for automotive industry executives seeking to navigate the complexities of international trade and tariff policies. As the automotive industry continues to face trade-related challenges, the ability to conduct detailed what-if analyses and make data-driven decisions becomes increasingly crucial for maintaining competitive advantage and ensuring long-term success. SAP Analytics Cloud stands as a powerful solution for organizations seeking to transform their approach to tariff impact analysis and strategic planning.

Contact us

Embedded Data Lake

Mastering SAP HANA Cloud Development with HDI Containers and SAP Datasphere

Introduction

It has become apparent that organizations need to store and analyze both their transactional data and their “big data” (unstructured text, video, and so on) together. However, historically, this has been a challenge as there were different types of repositories required depending on which type of data was being processed. Fortunately, solutions to this historic challenge are starting to become a reality. Thus, the integration of enterprise data with big data has become a pivotal strategy for organizations seeking to derive actionable insights. SAP introduced an embedded data lake to SAP Datasphere specifically to address this challenge. This blog delves into the potential of the Embedded Data Lake within SAP Datasphere, addressing common data integration challenges and unlocking the potential for added business value.

The Challenge

Across industries, enterprises grapple with the complexities of integrating SAP transactional data with other types of data. This challenge is rooted in the historical evolution of data repositories. Until relatively recently, there have been different types of repositories required depending on which type of data was being processed. Data Warehouses do a great job as a repository for transactional data. Data Lakes do a good job as a repository for raw, unstructured and semi-structured data. But they stand as separate silos, the implications of this include the following:

  • Complexity of Data Analysis: It is a challenge to manage, integrate, and analyze data across multiple repositories. The data is not in one unified environment which can be challenging for business users to navigate creating extra overhead and inefficiencies.
  • Cost Implications: With multiple repositories, organizations face additional expenditures on software, hardware, licensing, and appropriately skilled resources.
  • Operational Overheads: Solutions for items such as data tiering and archiving need to be designed for each repository, creating additional operational overhead.


Meeting the Challenge: Embedded Data Lake in SAP Datasphere

In a strategic move to address these challenges head-on, SAP unveiled SAP Datasphere, the evolutionary successor to SAP Data Warehouse Cloud, on March 8, 2023. A cornerstone of this innovative offering is the integration of an Embedded Data Lake, providing a seamless and unified data management experience within the SAP ecosystem.

Understanding the Embedded Data Lake

What is a Data Lake?

Before exploring the specifics of the Embedded Data Lake, it’s essential to understand the concept of a data lake. A data lake is a centralized repository that allows organizations to store all their structured and unstructured data at any scale. Unlike traditional data storage systems, data lakes can retain data in its raw format, enabling advanced analytics and deriving valuable insights from diverse data sources.

Embedded Data Lake in SAP Datasphere

An embedded data lake in SAP Datasphere integrates the powerful data lake functionality directly within the SAP environment. This integration provides users with a unified platform where they can store, manage, and analyze their data, leveraging SAP’s advanced analytics tools and applications. By embedding a data lake within SAP Datasphere, organizations can streamline their data management processes and unlock new possibilities for data-driven decision-making.
Benefits of Embedded Data Lake in SAP Datasphere

Unified Data Management

The Embedded Data Lake facilitates seamless integration of data within a single platform, streamlining data management processes and reducing operational complexity. The centralized nature of the data lake ensures that all relevant data is readily available, empowering users to make informed choices based on the most up-to-date information.

Scalability and Cost Efficiency

By leveraging the cost-effective data storage options within SAP Datasphere, and eliminating the costs of multiple repository solutions, organizations can optimize their data management costs. By eliminating the need for separate data integration solutions and infrastructure, the Embedded Data Lake drives cost efficiencies and maximizes ROI for businesses.

Data Tiering Scenarios: Cold-to-Hot and Hot-to-Cold

Effective data management often requires balancing performance and cost, which is where data tiering comes into play. The Embedded Data Lake in SAP Datasphere supports two data tiering scenarios to optimize your data storage strategy.

  • Cold-to-Hot: In a Cold-to-Hot tiering scenario, data that is initially stored in a cold tier (less frequently accessed and lower cost) is moved to a hot tier (frequently accessed and higher cost) as it becomes more relevant for real-time analysis. This ensures that critical data is readily available when needed, without incurring high storage costs for less frequently accessed data.
  • Hot-to-Cold: Conversely, in a Hot-to-Cold tiering scenario, data that starts in a hot tier (frequently accessed) is moved to a cold tier (less frequently accessed) as its relevance decreases over time. This helps manage storage costs by keeping only the most relevant data in the more expensive, high-performance storage tier.


Real-Time Analytics

With SAP Datasphere’s real-time processing capabilities, organizations can derive actionable insights from data in real-time, enabling agile decision-making.

In Conclusion – A Point of View

The Embedded Data Lake in SAP Datasphere represents a paradigm shift. By leveraging the full power SAP Datasphere, it paves the way for a future where data-driven decision-making is not just a possibility but a reality. As we look towards the future, the Embedded Data Lake stands poised to revolutionize the way we harness the power of data, ushering in a new era of innovation and growth. Feel free to reach out to us with questions or to schedule a free live demonstration of the SAP Datasphere embedded data lake.

Please complete the form to access the whitepaper:

HDI Containers

Mastering SAP HANA Cloud Development with HDI Containers and SAP Datasphere

What Are HDI Containers?

Before we get into the nitty-gritty, let’s demystify HDI containers. HDI stands for SAP HANA Deployment Infrastructure, a key service that helps you deploy database development artifacts into containers. Think of them as specialized storage units for your database artifacts. These artifacts include:

  • Tables
  • Views
  • Procedures
  • Advanced Artifacts: Calculation views, flowgraphs, replication tasks

The beauty of HDI is that it maintains a consistent set of design-time artifacts that describe the target state of SAP HANA database features, streamlining both development and deployment processes.

Integrating HDI Containers with SAP Datasphere

SAP Datasphere allows the assignment of built HDI containers to its spaces, providing immediate bi-directional access between HDI containers and Datasphere spaces without requiring data movement. This integration enhances flexibility and efficiency in data management and modeling processes.

  • Deploy HDI Containers: Use SAP Business Application Studio (BAS) to create and deploy HDI containers in the underlying SAP HANA Cloud database.
  • Assign Containers to Spaces: In SAP Datasphere, enable HDI Container access and assign the deployed HDI containers to specific spaces to access their objects and content immediately.
  • Refine Models in SAP Datasphere: Use the Data Builder in SAP Datasphere to create and refine models within your HDI containers. You can combine these models with others in Datasphere, ensuring seamless integration.
  • Refine Models in HDI Containers: Allow models and datasets from SAP Datasphere’s space schema to be utilized within your HDI containers, enabling a two-way interaction.

Business Use Cases for HDI Containers within SAP Datasphere

HDI container-based developments support a wide range of scenarios, including:

  • Migration from HANA Enterprise Data Mart to SAP Datasphere: Organizations can leverage multi-model analytics capabilities while migrating from HANA Enterprise Data Mart to SAP Datasphere. This transition allows for advanced data analytics and modeling within a modern, integrated environment.
  • Migration from SAP BW to SAP Datasphere: By utilizing native HANA developments, companies migrating from SAP BW to SAP Datasphere can maintain their existing data processes and enhance their data warehousing capabilities with the advanced features of SAP HANA Cloud.
  • External OData Consumption or Web API Exposure: SAP Datasphere enables the publication of space objects as external OData services or Web APIs. This capability facilitates seamless data sharing and integration with external applications and services.
  • Complex On-Prem Use Cases: Handle complex on-prem scenarios with limitations in adopting Datasphere.
  • Complex DB Procedures for Actionable Functionality: Develop and manage complex database procedures to implement actionable functionalities.
  • HANA Sidecar Phased Retirement: Gradually retire HANA sidecar systems by integrating with SAP Datasphere.
  • Migrate PAL and APL Use Cases: Migrate Predictive Analysis Library (PAL) and Automated Predictive Library (APL) use cases from on-premises to HANA Cloud.
  • Leverage Machine Learning Capabilities: Utilize embedded machine learning and advanced analytics within SAP Datasphere without data extraction.
  • Data Science Enrichment: Use existing Python or R environments to trigger calculations in SAP Datasphere, train ML models, and store prediction results in HDI container tables.
  Benefits of HDI Containers in SAP Datasphere

The integration of HDI containers within SAP Datasphere offers several significant advantages:

  • Immediate Access: Objects and content of HDI containers are instantly accessible within SAP Datasphere spaces without the need for data movement.
  • Seamless Workflow: Users can harness SAP HANA Cloud’s advanced features while enjoying a user-friendly environment in SAP Datasphere.
  • Advanced Data Modelling: HDI containers support complex developments and provide advanced functionalities that complement the user-oriented features of SAP Datasphere.
  • Git Versioning: HDI introduces the usage of versioning tools like Git, which helps in conflict resolution and allows many developers to develop in parallel without interference. This supports modern development styles and accelerates development cycles on the database.
  • Life Cycle Management: Supports automated CI/CD pipelines for efficient life cycle management.
  • Higher Parallelism: HDI supports higher parallelism with no singleton deployment, allowing for more efficient and faster deployment processes.
  • Debugging and Performance Optimization: HDI provides robust debugging and performance optimization capabilities, leveraging SAP HANA optimization techniques such as pruning and parallelization to ensure high performance.
  Conclusion

Combining the development strengths of HDI containers with the user-friendly features of SAP Datasphere offers the best of both worlds. This hybrid approach supports advanced and complex data developments while ensuring ease of use and maintainability. For large projects with multiple developers, the choice between HANA and Datasphere will depend on specific requirements, such as the need for version control and Git integration.

By leveraging HDI containers in SAP Datasphere, organizations can achieve seamless data management and complex data modeling capabilities, ultimately enhancing their data warehousing solutions.

For more detailed guidance on implementing HDI container-based developments in SAP Datasphere, refer to the comprehensive resources available on the SAP Community.

Feel free to contact us with questions or to schedule a demonstration of this capability.

Please complete the form to access the whitepaper:

Analytics 101: Understanding the Basics and Importance of Analytics

Analytics 101: Understanding the Basics and Importance of Analytics

Welcome to the world of analytics – where data becomes insights and decision-making becomes more informed. Analytics is the process of using data to gain insights and make informed decisions. In today’s data-driven world, analytics is becoming increasingly essential for businesses of all sizes and industries. In this article, we will explore the basics of analytics and its importance in the modern business landscape.

What is Analytics?

Analytics is the process of collecting, storing, and analyzing data to identify patterns, relationships, and trends that can inform decision-making. Analytics can help businesses uncover insights that they might not have otherwise seen, and make data-driven decisions that are based on facts and figures rather than gut feelings or intuition.

Types of Analytics

There are several types of analytics, including:

Descriptive analytics: This type of analytics describes what has happened in the past. It involves collecting and analyzing historical data to identify patterns and trends.
Diagnostic analytics: This type of analytics explains why something happened. It involves analyzing data to understand the root cause of a problem or opportunity.
Predictive analytics: This type of analytics predicts what will happen in the future. It involves using statistical models and machine learning algorithms to forecast future trends and behaviors.
Prescriptive analytics: This type of analytics recommends what actions to take. It involves using data and models to identify the best course of action to achieve a specific goal.

Importance of Analytics

Analytics can be applied in various industries, such as finance, healthcare, marketing, and sports. It can help businesses improve their efficiency, reduce costs, and increase revenue. Analytics allows businesses to:

Gain insights: Analytics provides businesses with insights that they might not have otherwise seen, which can help them make informed decisions.
Identify opportunities: Analytics can help businesses identify new opportunities that they might not have otherwise seen, such as new markets or products.
Make data-driven decisions: By using analytics, businesses can make data-driven decisions that are based on facts and figures rather than gut feelings or intuition.
Improve efficiency: Analytics can help businesses identify areas where they can improve their efficiency and reduce costs.
Increase revenue: By identifying new opportunities and making data-driven decisions, businesses can increase revenue and gain a competitive advantage in their industry.

Conclusion

In conclusion, analytics is a powerful tool that can help businesses make data-driven decisions and gain a competitive advantage in their industry. By leveraging analytics, organizations can gain insights, identify opportunities, and make informed decisions that improve their performance. If you’re interested in leveraging the power of analytics for your business, consider partnering with a team of experts who can help you collect, store, and analyze data effectively. Contact us today to learn more!

The SAP DWC Bridge: Easing the Journey to the Cloud for SAP BW Customers

The SAP Datasphere BW Bridge: Easing the Journey to the Cloud for SAP BW Customers

If you have an existing SAP BW or BW/4HANA on premise data warehouse, you are likely well aware that it didn’t just appear overnight fully loaded with data and analytics solutions but rather was developed with lots of thought, care, and attention.  With the advent of all things cloud, including data warehouses, what does it mean to all the accretive knowledge, business logic, and code that is encompassed in our existing solutions?

With the marketing and media attention on the cloud, we are bombarded with all the benefits that a cloud solution can bring.   SAP has delivered a top-notch, long-term cloud data warehouse and analytics solution set in SAP Datasphere (SAP DSP) and SAP Analytics Cloud (SAP SAC).  This solution set provides a business focused, innovative, and fully cloud based BI solution.  SAP DWC is the strategic, target solution for all data warehouse uses in SAPs statement of direction. And while that all sounds like a wonderful panacea, it can be a bit daunting to think about how to get from point a (our on-prem solution) to point b (a cloud DW solution).

The Bridge Concept

Fortunately, SAP has come up with a practical and innovative solution to make it much easier for their customers to start their cloud journey to the SAP DSP solution:  the SAP DSP Bridge.   At the heart of it, the bridge is a tool that customers can leverage to 1) move at their own pace to the cloud and 2) at the same time leverage their existing BW base in the cloud quickly.

There are some key guiding principles that the SAP DSP Bridge solution embodies:

  • Reuse. Reduce, reuse, recycle!  SAP has recognized that redoing work that has already been done is not a fan favorite.  After all, there was a lot of effort put into carefully crafting all the current SAP BW and SAP BW/4HANA data warehouses out there. 
  • Connect to data sources with confidence and in a familiar manner.
  • Innovate! Leverage the benefits of the cloud to innovate sooner rather than later with our existing SAP BW assets.

What the Bridge Does

The SAP BW Bridge transfers key elements of an existing BW environment into a custom space inside SAP DSP so departments can share access to critical data.  With SAP BW Bridge, key content, data, staging, customization and connectivity is transferred to a purpose-built space inside of data warehouse cloud, where it can now be leveraged by other data users as if it was any other data space inside of the DSP environment.

  • Reuse, not rebuild data models, transformations; and customizations to protect investments
  • Accelerate time-to-value with 70-80% reuse of existing BW artifacts with transfer tools
  • Capitalize on your existing expertise with access to a familiar modeling and development environment

Unlike other cloud solutions, this preserves the use of most customizations and custom data objects from BW.

What the Bridge Enables

Once the bridge to the DSP is enabled for your BW solution, you gain new abilities to work with your data assets including:

  • Retain familiar connectivity to SAP data and semantics efficiently with ABAP-level extractors, staging area and understanding of SAP data and relationships 
  • Extend your data reach easily to new data sources and take advantage of the Data Marketplace to combine SAP and external data for broader insights
  • Connect data efficiently across clouds and hybrid landscapes without unnecessary data movement – unmatched data virtualization across multiple clouds

This makes it easier to transition your workflows to leverage the power of new technologies such as SAP’s upcoming Data Marketplace.

To summarize, SAP BW Bridge allows you to retain much of the power of your original BW environment inside SAP DSP quickly.  You can start reaping the benefits of the DSP cloud platform even before fully migrating to it.  The bridge tool allows you to chart your own journey and timeline to migrate to the cloud without forcing you into a big bang cutover.

This tool will help us all in our mission to breakdown business silos and empower users with the latest information, all running on the proven HANA database management system, designed specifically to take on today’s most challenging, multi-model analytics problems. 

With SAP BW Bridge, you gain the power of bringing your systems together as part of SAP’s Business Technology Platform. This powerful platform was engineered by SAP not only to meet the critical needs of today’s processing but to grow with you to meet your business’s challenges for years to come. 

If you’d like to know more or would like a bit of help charting your journey with the SAP BW Bridge and SAP DSP, we’d love to help.  Contact us using the form below.

– By Merri Beckfield

Business Objects Move to Hybrid Cloud

Starting Your Journey to Business Objects Cloud

Today many organizations rely on business intelligence and run multiple BI platforms that address different business needs. With cloud-based BI tools coming into vogue, Business Objects and other products, like Tableau, Power BI, and QlikView, are at a crossroads. With SAP’s future road map retiring the Business Objects on-prem licensing model, it is critical to ensure the IT roadmap has a solid strategy for addressing this situation.

Recognizing that the future is digitization, SAP is pursuing a strategy of delivering an entire business analytics platform in the cloud. Although SAP has pledged Priority 1 support for BOBJ SP4.3 through the year 2027, the future investment will focus on SAP Analytics Cloud.

For many organizations, no other product can easily replace Business Objects.  The universe model is secure, convenient, scalable, and the foundation on which the reporting structure is built.  Redeploying all this from the ground up directly into SAP Analytics Cloud can be a massive undertaking.  The thought of moving “big bang” from BOBJ to another tool can be a significant barrier to progress to an analytics cloud platform.  There is another way.

Consider a move to a hybrid cloud-based model consisting of SAP Business Objects private cloud edition paired with SAP Analytic Cloud.  This allows you to take advantage of the benefits of the cloud while retaining access to universes and moving content to SAC when and where it makes sense.

For many organizations, BOBJ is an invaluable asset. The adage, “if it isn’t broke, don’t fix it” applies. The continued loyalty of customers depends on the SAP’s continued commitment to Business Objects.

LOOKING TO THE FUTURE AND BUILDING ON THE PAST:  We have extensive knowledge of the Business Intelligence ecosystem and can say with certainty that the landscape is changing.

To stay on top, organizations should leverage their assets by opening up to hybrid options and other BI analytics tools. In this scenario, rather than being replaced by other BI tools, Business Objects will remain the foundation and create new growth opportunities.

Tek Analytics can help you evaluate the hybrid strategy of Business Objects Private Cloud Edition and SAC.  This can allow you to shift on-premise workloads to a managed cloud environment that will continue to evolve and be supported beyond 2027.    Contact Us today to learn more!

Contact TEK – Tek Digital Transformations (tek-analytics.com)

– By Merri Beckfield

Recycling of Data: Taming the Data Deluge

Reduce reuse

Recycling Of Data: Taming The Data Deluge

Reducing, Reusing, and Recycling your data to get it under control


Many of us have heard the phrase “Reduce, Reuse, Recycle” for many years.  When hearing that phrase, it conjures up images of plastic water bottles, milk jugs, and soda cans.   Have you ever stopped to think of how these three words could be applied to the never-ending flood of data sources in our organizations? 


As many of us can attest, our data houses are becoming messy, and the stuff is piling up.   Our teams are getting overwhelmed in trying to deal with the deluge.  The refrains of “we have the data, but we can’t find it” Or “It is like looking for a needle in a haystack” are becoming all too common.


According to a recent report by Seagate1, they project a 42.2% annual growth rate of enterprise data over the next two years.  The data deluge is an issue for organizations today that threatens to become a serious risk in the future if not addressed.  Our data houses are chaotic, and it is difficult to know where to start to get it under control.


Here is where concepts borrowed from recycling can help:


  • Recycle – Recycle the tried-and-true techniques for organizing and managing work.  Dealing with data, while considered a bit esoteric, is just another type of work.  Get the work identified, prioritized (or de-prioritized if appropriate), and scheduled on a roadmap. 

  • Reduce – Reduce the amount of data sources used in your organization. Not all sources are created equal. Identify which sources are both relevant and reliable.  Eliminate the clutter and noise from the others.

  • Reuse – Investigate methods to share data knowledge. It is amazing how something as simple as a bi-weekly “birds-of-a-feather” sharing session across the key analysts in the organization can help with this.  Promote collaboration and sharing amongst the data analysts in your organization.  A bit of time invested up-front can pay off big-time in reduced rework.


If you’d like help in taming the data deluge, we can help.  Our resources have techniques that can assist you in Reducing, Reusing, and Recycling your data to get it under control.  Contact TEK – Tek Digital Transformations (tek-analytics.com)


1 Rethink Data | Seagate US


– By Merri Beckfield

Predictive Scenario on Regression

Predictive Scenario On Classification.

Smart Predict is an Augmented Analytics feature in SAP Analytics Cloud that helps you generate predictions about future events, values, and trends.

The predictive experience in SAP Analytics Cloud is simple. Smart Predict guides you step by step to create a predictive model based on historical data. The resulting model can be used to make trusted future predictions, providing you with advanced insights to guide decision-making.

Smart Predict accelerates the prediction and recommendation creation process by focusing on business outcomes.

Before using Smart Predict for the first time, it really helps to understand a few basic concepts of predictive modeling. So, here they are!

The different types of predictive scenarios

There are currently 3 types of predictive scenarios available in Smart Predict:

  • Classification
  • Regression
  • Time Series

Defining the business problem or business question you want to address will help you choose the right type of predictive scenario.

Classification Scenario: If you’re trying to determine the likelihood of whether something will happen, you’re dealing with a classification scenario.

Ex: You want to predict membership of categories such as Yes/NO, Customer is likely to churn or not, replacing intervals within short or long for the manufacturing process, Binary (0 or 1).

Regression Scenario: If you’re trying to predict a numerical value and explore the key drivers behind it, you’re dealing with a regression scenario. 

Ex: Predict the price of an imported product based on projected transport charges and tax duties.

 Time Series Scenario: If you’re trying to forecast a future numerical value based on fluctuations over time, seasons, and other internal and external variables, you’re dealing with a time series scenario.


Predictive Scenario based on Regression:

Step 1. Loading the data

• Before we load the dataset into SAC, we cut out a few records from the original dataset. We will use this to apply our model later. I cut out 20 records of each wines from the dataset for red and white wines, each to use later. Now I have 4 datasets as follows.

A.         1580 red wines for training

B.         20 red wines for prediction

C.        4879 white wines for training

D.        20 white wines for prediction

At first create a folder in your files to save all the files at one place.

Inside your newly created folder, create a new dataset by clicking ‘+’ icon → Dataset .

Now you will be asked how you would like to begin – load data from a local file or from a data source. Since we have data in csv files, click on local data source. Select your source file. Load all 4 datasets. Your folder should look like the last screenshot.


Step 2. Training the model

  1. Let us now build the predictive scenario. This is where our models to predict wine quality will be built and trained. On the main menu, click on Create >> Predictive Scenario.
  2. For this problem, our predicted entity is an integer between 0 to 10. So, we will build a regression model. Select regression, give the scenario a suitable name and description.

In the Predictive Scenarios page click on ‘+’ to add a scenario.

Select a scenario that best suits to your analytic dataset.

Fill the details and click on OK.

Select the Input Dataset as show below.

  • If you want edit the edit metadata, Click on Edit variable metadata (under the input dataset field) to understand how SAC has interpreted the dataset, what is the storage and type of each of the variables, what should SAC do with missing values, is the variable the key of the dataset, etc.

  • We now need to define the variable we wish to predict. In our case this is quality of the wine, so click on Target and select quality.

  • If there are variables in the dataset, you would like to exclude from modelling, declare them here as show below. This helps to Improve the results.

  • Now that SAC knows what it needs to do, we can get started with training. Click on Train at the bottom.

SAC will take a while to train with the data set, and identify the best model for this problem statement. Then you now have results of your model as shown below.


Step 3. Understanding the results

  • After you click on Train, and SAC completes the training process, it will show you 2 tabs of information.
  • Overview tells you about the quality of the results
  • In our cases it is 99% confident about its results.
  • It also says that the error is 0.8. This means that the true value is ±0.8 from our prediction. 
  • The influencer contributions explain the results
  • Density of the wine and sugar understandably have the highest correlation with wine quality, followed by the other variables.

Step 4. Applying the model

  • Now that our model is ready, we can apply it on the dataset we had carved out earlier.
  • Click on the apply model option (icon at far right).


  • At Input Dataset Variables selects the variables that you would like to see in the output.

  • Fill all the details as shown below and click on Ok.

  • Then go to the folder to check the predicted model and click on the model. You can see, in the predictions file, see the column at far right called Predicted Value.

Repeat the same steps to know the quality of the Red wine.

  • I found the model for red wines had an error of 0.69 with a confidence of 95%. Alcohol seems to be the dominant predictor.
  • I can see both my models in the predictive model’s section at the bottom. I can see status of models (trained / applied).

Create a model based on the Output Dataset of the Predictive Scenario.

Click on Menu → Create→ Model→ Click on Get data from datasource and in the Acquire Data select Dataset.

  • Select the Dataset.

  • Click on the Create Model on the bottom.

Or You Can directly create a story on Dataset.

Go to Create → Click on Story

  • Click on Access & Explore Data as shown below.

  • Click on Datasource and click on the Dataset as shown below.


  • Select the Dataset.

  • Click on the Story and start creating story.


Need additional assistance? Contact us today!

Schedule Publications for your Stories and Analytics applications in SAP Analytics Cloud

Schedule Publications For Your Stories and Analytics Applications in SAP Analytics Cloud

SAP Analytics Cloud is introducing one of the most asked features on Scheduling Stories and Analytical Applications with its latest update 2020.03.

We call it as Schedule Publications. With this, you would be able to Schedule a Story and also an analytical application with recurrence and distribute the same as a PDF over email to a number of different SAC and Non-SAC recipients. And do much more things like, you can even include a customized message in the email per the schedule and attach a link as well to the view of the story in online mode which can be used to check the latest online copy of the story / analytical applications.

Note: Schedule publications would be available only for SAP Analytics cloud Tenants based on the AWS data center (Cloud foundry based).

You can create a single schedule or even a recurring one with a defined frequency like hourly, daily, weekly.

Let’s get started:

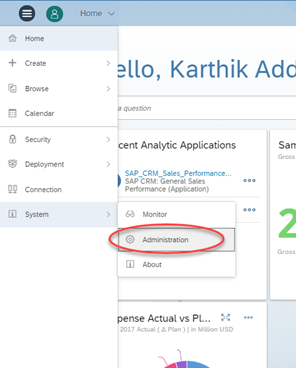
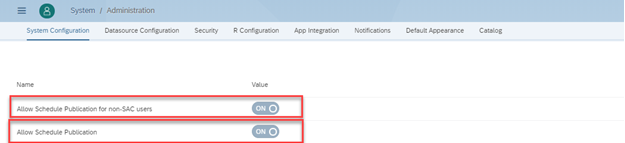
At first, Schedule Publications needs to be enabled by your organization SAP Analytics cloud admin on the Tenant level. To do the same, please log in as Admin and go to System -> Administration and enable the Toggle as shown below.

Allow Schedule Publications” and “Allow Schedule Publication to non-SAC users

If you want to allow your schedules to be sent over to Non-SAC users as well along with SAC users, Please enable the toggle option as shown below.

Schedule Publications is not by default enabled   to all users in your organization, your admin needs to assign to a template who would have rights for creating schedules.  To do the same. under the SAC Tenant application menu. Go under the Security -> Roles and click on any existing role where you would like to add Schedule Publications right.

How to create Schedule Publications?

You can create a schedule IF

  • If you are a BI Admin or an Admin. By default, these roles come with the Schedule Publication permission.
  • If the Schedule Publication permission has been assigned to a custom role created.
  • If you have a Save or Save As permission to a story once the Schedule Publication permission is given.

Once a user has been granted access to create schedules

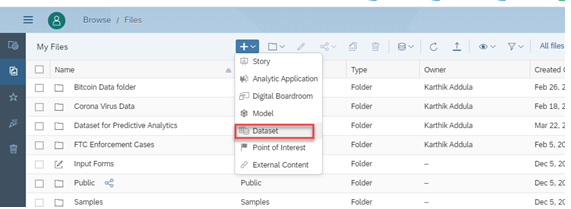
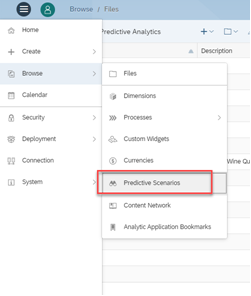
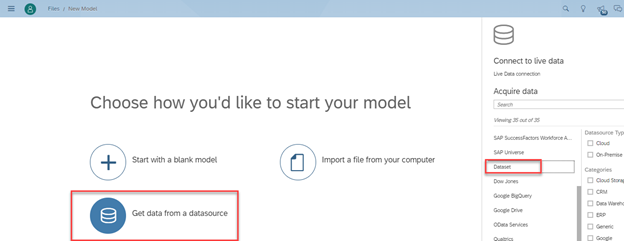
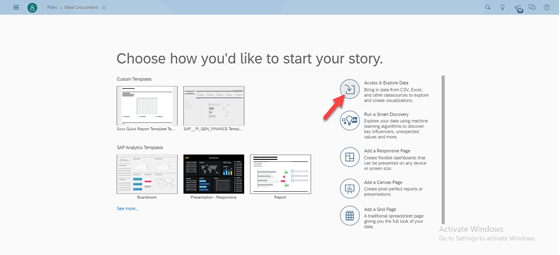
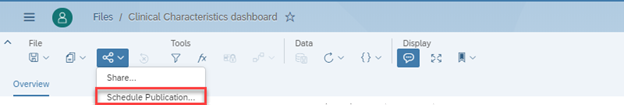
  • Select the Story / Analytical application under the browse files (By using the checkmark) and then choose the option Share  -> Schedule Publications as shown below or

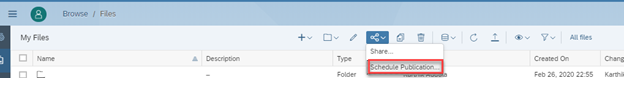
  • The other way is to open a Story and the again go under share option and select Schedule Publication.

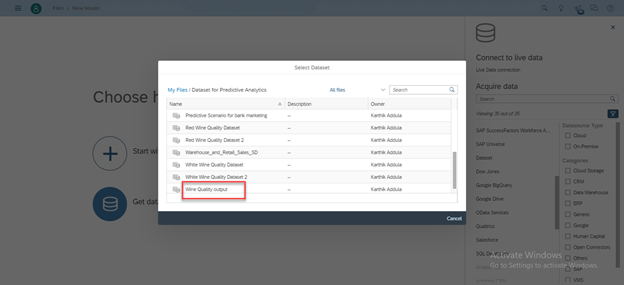
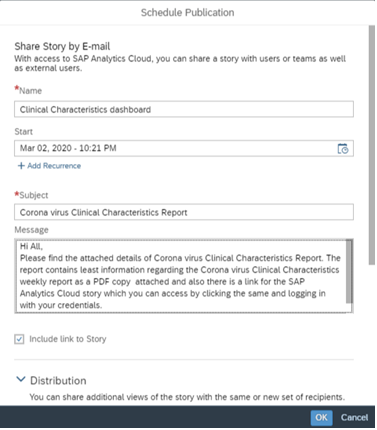
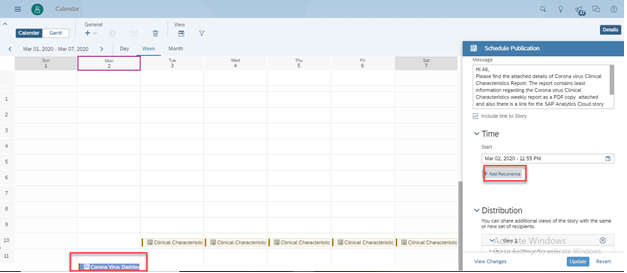
  • Once the Schedule Publications Dialog box opens, Input the details as required.

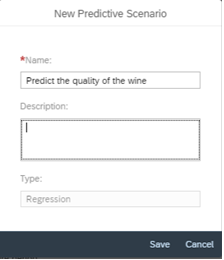
Name: Provide a name for your Schedule

Start:  Provide a start date for your schedule with a defined time or you can add recurrence

details as well by selecting the option “Add Recurrence”.

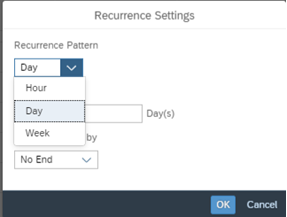
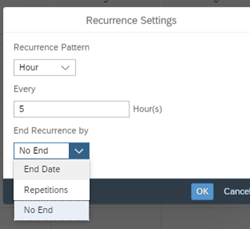
Under Recurrence, you can define the recurrence pattern to be hourly, daily, weekly as different options and also the number of times needs to be repeated including the end of occurrence details.

Topic: This is the subject for the email which would be delivered to the recipients

Message: This is the body of the message for the email which would be sent to the recipients over email.

Include Story Link:  If you select this checkmark, then the story/ analytics application link would be sent along with the email. If you happen to personalize the publication by selecting a bookmark to be delivered (Given below), then the personalized bookmark view link would be embedded.

Distribution: Here you can define the view of the story which needs to be delivered to the recipients. You can personalize different users or teams with different views of the same story to be delivered with the help of bookmarks available for stories. If your stories have multiple bookmarks where each of the bookmarks are relevant for different users/teams, you can make use of the same, else create one. The advantage you find with the bookmarks is you can create a unique personalized view by applying different filter options and create views. 

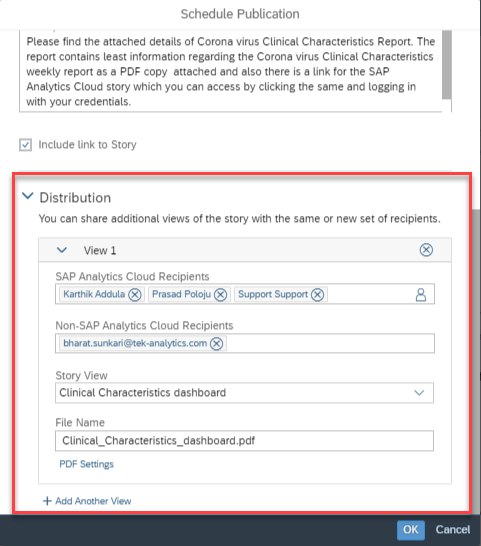
Distribution (Continued): You can create one or more than view (as story default view or different bookmarks) which can be delivered to different SAC users/teams. Let’s focus on one view and understand all options. Next to the Down-arrow, Double click “View1” and provide a name for your view. Below screenshot describes to be “Corona virus Clinical Characteristics Report”.

  • SAP Analytics Cloud Recipients: Click the person icon and select the different SAC user recipients or teams
  • Non-SAP Analytics Cloud Recipients: These are the users who are not a part of SAC user lists or a part of SAC tenant. You can include their email address by manually typing their addresses. Under the default SAC Analytics Cloud licensing, Per View, you can input a maximum of 3 Non-SAC Recipients.
  • Story View: Choose the Story/Bookmarks view which you want to deliver to the above recipients. You can choose between Original Story, Global Bookmarks and as well My Bookmarks. the authorization on the story publication would be same as schedule owner and the exact view would be delivered to different recipients.
  • File Name: Name of the publication which would be delivered to the recipients
  • PDF Settings: You can select this option to define the PDF settings like what all pages you want to deliver, the grid settings for different columns and rows selection, choose to insert appendix which has details on metadata information on the story.

Once you are done with all the details then, Click OK and create your Schedule.

How to view my Schedules created and as well how can I Modify the Schedule?

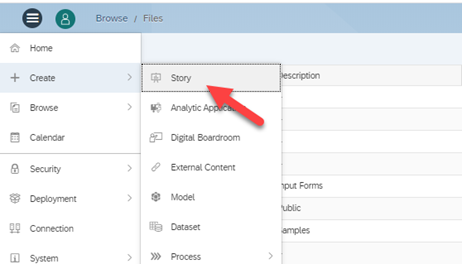
You can view the Schedule created under the Calendar view. Go to the SAC application menu and select Calendar. You can see the schedule created right there.

If its recurrence schedule, then you would see against multiple different dates /time as defined by the schedule owner.

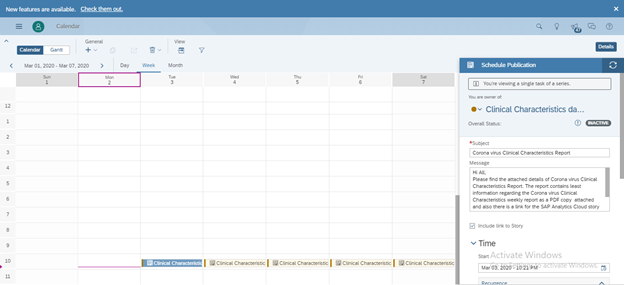
You can as well modify a single recurrence or the entire series occurrence. Select the occurrence from the calendar view and on your right side, a new panel opens where you can modify as shown below.

You can edit the Referrence Setting for Reference Pattern and End Reference by as interested and click on OK and click on Update to save the changes.


As and when the clock ticks it’s time, The Schedule publication picks the job and creates the publications and send it to the different recipients defined as an attachment over email. The maximum mail delivery size allowed per email including attachment is 15MB.

Schedule Publications in itself is a resource intensive tasks which includes the Schedule publications engine on the cloud hosted on SAP Analytics Cloud do a variety of jobs in the background for creating the publications including the email delivery. Out of the box with the standard licensing you would get limited number of schedules.

Need additional assistance? Contact us today!