Enabling Business Friendly Semantics in Power BI from SAP Datasphere.

Enabling Business Friendly Semantics in Power BI from SAP Datasphere. 

As a large commercial construction company, with a long history in North America, Barton Malow is committed to building People, Projects, and Communities. While Barton Malow has been in business for over 100 years, they are not resting comfortably with past processes.  Rather, Barton Malow is on a mission to transform the construction industry through innovation and increased efficiency in the building process.   

To that end, they are focused on leveraging data and having a data-driven culture to aid them in their mission.  However, on the journey they encountered a bit of a road bump with SAP Datasphere and Power BI.   

 
THE PROBLEM 

To get started, here is a bit of background on the situation. The Barton Malow team was facing a significant challenge with the inability to automatically feed business metadata from SAP Datasphere into Power BI. In addition, Datasphere does not check for duplication of business names (only technical names are checked) and if duplicate business names are in the same source, the Power BI load failed. 

This limitation necessitated the implementation of a manual process for gathering and loading data into Power BI daily.  The workaround consisted of manually pulling the metadata into a JSON file then putting through a PBI rename step. This not only increased the risk of errors but also consumed valuable time and resources, hindering the company’s ability to leverage data-driven insights effectively and efficiently. 


THE SOLUTION 

To overcome these problems, the Tek team worked with them to thoroughly understand the current situation and design an automated solution to the issues.   The solution leveraged the HANA cloud directly using Business Application Studio and modeling HDI container based calculated views, which were then accessed by Power BI.  This approach enabled the retrieval of business names without manual intervention. 


THE RESULTS 

At the end of the day, the outcome was a solution that provided: 

  • Improved business process efficiency with the elimination of manual processes. 
  • Seamless availability of business names in Power BI to support self-service and data-driven culture. 


Ready to move your data strategy forward and unlock the full potential of your data? This client success story is just one example of how we help businesses modernize their data architectures, streamline operations, and drive faster decision-making.   


Let us help you achieve the same success! Contact us today to discuss how we can support your migration to SAP Datasphere.   Contact TEK – Tek Digital Transformations 


STREAMLINING AUTOMOTIVE INCENTIVES PLANNING

By – Merri Beckfield
STREAMLINING AUTOMOTIVE INCENTIVES PLANNING


Most car buyers likely aren’t aware of the work put into planning the incentives we often see advertised.  That is, those special offers (such as cash back or an amazing 0% interest rate) encouraging each of us to purchase a new vehicle.  The effort that car manufacturers put into this is quite significant.  The number of variables that need to be considered to come up with an incentive offering that is competitive, cost effective, and drives sales is somewhat daunting.  Factors beyond the forecast of demand, costs, and manufacturers margin such as the impact to the margin of the car dealer and varying market conditions by state create added complexity.

In collaboration with a large-scale automotive manufacturer, we tackled the challenge of streamlining the automotive incentive planning process. By implementing an end-to-end solution which leveraged predictive techniques, automation, and strong change management the team was able to streamline the process: reducing the duration from weeks to days and delivering an 80% reduction in manual interventions.


“Our planners love the new experience and we as a leadership team, we are thrilled with the improved speed to market.”​ – Director of FP&A


THE PROBLEM

Before diving in, it’s important to understand the challenges that were being faced by the manufacturer driving the need to do something.  The supply chain was in a state of turmoil, and rising banking interest rates were significantly impacting auto incentives. Financial closing was a cumbersome and complicated process due to the intricacies of dealer contract terms and dealer stock. The organization was finding it nearly impossible to react to market conditions and adapt new promotions to the market without engaging in heavy manual labor. Incentive planning was a time-consuming and manual task, lacking the flexibility needed to keep up with the fast-paced market.


THE VISION

To improve the situation, the auto manufacturer clearly defined their vision and objectives. First, they wanted to tackle the entire incentives lifecycle, ensuring that the evolving incentives management systems could deliver meaningful business value across all system elements. A major focus was enabling granular geographic planning, allowing for more precise program design and targeted deployment. Specifically, the ability to plan targeted incentive offers down to the region or state level. Second, they wanted to streamline operations via automated program execution integrated with financial systems, which would lead to faster, more reliable incentive rollouts. This needed to include the ability to include considerations around dealer stock in the closing process. Finally, they sought to enhance post-mortem program performance analysis, enabling their brands to effectively balance volume and profit margins while achieving both brand and corporate sales objectives.


THE SOLUTION

To overcome the challenges, together the team came up with a strategy and plan to develop an end-to-end incentives life cycle planning application which considered all the key variables.  The solution not only leveraged predictive analytics to create a granular plan by geography to the region/state level, but it also leveraged workflows, along with automation to streamline the planning process.

One key to success of the solution was leveraging SAP Analytics Cloud as the single enterprise planning tool.   By providing end-to-end capabilities in a “one stop shop”, manual interventions were minimized.  Planning duration was reduced from weeks to hours. 

From a technical point of view, the technology powering the solution was SAP Analytics Cloud for the planning functions. Data harmonization was done in BW4HANA.  To achieve, VIN level planning write back functionality to BW4HANA was leveraged. 

From a business point of view, the following capabilities of the solution were transformative:

  • Including dealer stock considerations in the financial close process.
  • Having flexibility in managing dealer margins.
  • Being able to plan and create targeted offers down to the state level.


THE RESULTS


With a remarkable 80% reduction in manual tasks, the team significantly minimized manual interventions, allowing planners to focus on more strategic initiatives. The application has enabled effective budget allocations and provided real-time spend visibility, which means users can make informed decisions more rapidly.

Users are enjoying an improved experience thanks to the seamless integration of sales, incentive, and financial planning, along with automated financial adjustments that streamlined processes. Collaborating with stakeholders to design effective workflows has paid off, as users now can analyze and plan incentive budgets much more efficiently.

Plus, reconciling incentives and optimizing programs has never been easier! The flexibility to add new planning models on-the-fly and personalized reporting options, complete with filters for models and even VINs, empower users to align plans across programs and measure their effectiveness.

Overall, this application has not only enhanced operational efficiency but also fostered a culture of collaboration and data-driven decision-making.


The partnership between our organization, TEK and SAP, was incredible.
​We were able to leverage SAP Analytics Cloud to modernize and automate a process that was broken and expensive.
….
TEK brought in the best-in-class experts with deep automotive industry experience and thought leadership​”
Director Finance and Planning
 

If you are facing a similar planning challenge (regardless of industry), let us help you achieve the same success! Contact us today to discuss.  
Contact TEK – Tek Digital Transformations

Got Data, but No AI? Why Your Data Architecture Might Be the Problem

Got Data, but No AI? Why Your Data Architecture Might Be the Problem

Are you facing this too?

It’s more common than you think.

A company kicks off an AI project.
The budget’s approved. The latest tools are in place. A smart, capable data team is ready to roll.

Everyone’s excited—AI will predict problems, streamline decisions, and cut costs.
But a few months in… things start to stall.
The ideas looked great on paper—but in practice? Nothing really works.

So, what went wrong?

It’s not the people.
It’s not the tools.
It’s not the money.

The real roadblock? The data.
It’s messy. Disconnected. Spread across silos.
And that makes it nearly impossible for AI to deliver real results.

Having Data Isn’t the Same as Using Data

These days, most companies have plenty of data. Sales records, customer details, machine logs, website clicks the list goes on. But here’s the problem: that data often lives in different systems. The sales team can’t easily see what the operations team has. The finance data is stored separately. Different formats, different rules, no easy way to connect it all.

So, when you try to use AI, it struggles. It either can’t find what it needs, or it ends up working with bad, confusing data. And that means the insights it produces don’t help the business move forward.

Why Your Data Structure Matters So Much

Think of your data like building blocks. If they don’t fit together properly, you can’t build anything strong no matter how advanced your AI tools are.

Here’s a simple comparison that shows what a weak setup looks like versus a strong one that’s ready for AI:

Weak Data Setup
Strong Data Setup

Data stuck in silos, hard to combine

Data connected across teams and systems

Outdated or messy data

Clean, consistent, high-quality data

Slow, manual preparation

Automated data flows ready for AI

Hard to get current info

Real-time data availability

Risk of compliance issues

Strong governance and secure practices

When your data is structured well, AI can deliver the insights, predictions, and automation you want.

The Hidden Costs of a Weak Data Setup

When companies don’t focus on fixing their data structure, they end up paying for it in other ways. Teams spend too much time just cleaning and organizing data instead of building AI models. The insights that come out of AI often aren’t useful because the data is messy. And delays pile up — months go by before the business sees any value from its AI efforts. All of this creates frustration across teams and wastes valuable time, energy, and budget.

What You Can Do

The good news is this can be fixed. The first step is to stop thinking of data as just an IT issue. Data is a core part of the business plan; it powers the decisions you want AI to help you make. That means planning your data setup with your AI goals in mind. Companies that succeed here often rethink how their data is connected, explore modern ways to manage and govern it, and make sure the data is accurate, safe, and up to date.

When the foundation is solid, AI can finally do what it’s supposed to help your business grow smarter, faster, and stronger.

The Big Takeaway

Having data is just the start.

If AI isn’t delivering the value you hoped for, take a closer look at how your data is structured. Fix that, and you’ll unlock the real power of AI.

Data Fabric – A Game Changer

Data Fabric - A Game Changer 

Today, businesses have access to more data than ever before. It comes in all kinds of sizes, types, and locations. With all this data comes a challenge – how to manage it effectively to drive meaningful insights and results. That’s where data fabric
comes in. Data fabric is an emerging technology that enables businesses to manage their data in a more efficient and streamlined way. It’s essentially a unified data management platform that brings together data from multiple sources and makes it accessible in one place.

This game-changing technology is set to transform the way businesses operate, allowing them to make more informed decisions and ultimately, drive growth. In this article, we’ll explore what data fabric is, how it works, and its benefits for businesses of all sizes. Read on to discover how data fabric can help you achieve
your goals

Please complete the form to access the whitepaper:

A Look at Artificial Intelligence in SAP’s Business Technology Platform

A Look at Artificial Intelligence (AI) in SAP's Business Technology Platform (BTP) 

Looking to elevate your company’s performance? Aiming to enhance the speed and effectiveness of your operational processes? Or maybe seeking a superior method for forecasting? fI so, it’s time to explore the Artificial Intelligence solutions offered by SAP within the SAP Business Technology Platform. By harnessing the power of Al, your organization can significantly enhance performance, improve decision making, advance innovation, and boost customer satisfaction. As demonstrated by the quick rise of Al tools like ChatGPT, Al has now reached a level of maturity where it can offer significant benefits to businesses that utilize this technology. In this article, we will explore the role of Al in modern businesses, the key components of SAP BTP’s Al offerings, and real-world use cases that demonstrate how SAP’s Al solutions are transforming business.

Please complete the form to access the whitepaper:

Analytics 101: Understanding the Basics and Importance of Analytics

Analytics 101: Understanding the Basics and Importance of Analytics

Welcome to the world of analytics – where data becomes insights and decision-making becomes more informed. Analytics is the process of using data to gain insights and make informed decisions. In today’s data-driven world, analytics is becoming increasingly essential for businesses of all sizes and industries. In this article, we will explore the basics of analytics and its importance in the modern business landscape.

What is Analytics?

Analytics is the process of collecting, storing, and analyzing data to identify patterns, relationships, and trends that can inform decision-making. Analytics can help businesses uncover insights that they might not have otherwise seen, and make data-driven decisions that are based on facts and figures rather than gut feelings or intuition.

Types of Analytics

There are several types of analytics, including:

Descriptive analytics: This type of analytics describes what has happened in the past. It involves collecting and analyzing historical data to identify patterns and trends.
Diagnostic analytics: This type of analytics explains why something happened. It involves analyzing data to understand the root cause of a problem or opportunity.
Predictive analytics: This type of analytics predicts what will happen in the future. It involves using statistical models and machine learning algorithms to forecast future trends and behaviors.
Prescriptive analytics: This type of analytics recommends what actions to take. It involves using data and models to identify the best course of action to achieve a specific goal.

Importance of Analytics

Analytics can be applied in various industries, such as finance, healthcare, marketing, and sports. It can help businesses improve their efficiency, reduce costs, and increase revenue. Analytics allows businesses to:

Gain insights: Analytics provides businesses with insights that they might not have otherwise seen, which can help them make informed decisions.
Identify opportunities: Analytics can help businesses identify new opportunities that they might not have otherwise seen, such as new markets or products.
Make data-driven decisions: By using analytics, businesses can make data-driven decisions that are based on facts and figures rather than gut feelings or intuition.
Improve efficiency: Analytics can help businesses identify areas where they can improve their efficiency and reduce costs.
Increase revenue: By identifying new opportunities and making data-driven decisions, businesses can increase revenue and gain a competitive advantage in their industry.

Conclusion

In conclusion, analytics is a powerful tool that can help businesses make data-driven decisions and gain a competitive advantage in their industry. By leveraging analytics, organizations can gain insights, identify opportunities, and make informed decisions that improve their performance. If you’re interested in leveraging the power of analytics for your business, consider partnering with a team of experts who can help you collect, store, and analyze data effectively. Contact us today to learn more!

The SAP DWC Bridge: Easing the Journey to the Cloud for SAP BW Customers

The SAP Datasphere BW Bridge: Easing the Journey to the Cloud for SAP BW Customers

If you have an existing SAP BW or BW/4HANA on premise data warehouse, you are likely well aware that it didn’t just appear overnight fully loaded with data and analytics solutions but rather was developed with lots of thought, care, and attention.  With the advent of all things cloud, including data warehouses, what does it mean to all the accretive knowledge, business logic, and code that is encompassed in our existing solutions?

With the marketing and media attention on the cloud, we are bombarded with all the benefits that a cloud solution can bring.   SAP has delivered a top-notch, long-term cloud data warehouse and analytics solution set in SAP Datasphere (SAP DSP) and SAP Analytics Cloud (SAP SAC).  This solution set provides a business focused, innovative, and fully cloud based BI solution.  SAP DWC is the strategic, target solution for all data warehouse uses in SAPs statement of direction. And while that all sounds like a wonderful panacea, it can be a bit daunting to think about how to get from point a (our on-prem solution) to point b (a cloud DW solution).

The Bridge Concept

Fortunately, SAP has come up with a practical and innovative solution to make it much easier for their customers to start their cloud journey to the SAP DSP solution:  the SAP DSP Bridge.   At the heart of it, the bridge is a tool that customers can leverage to 1) move at their own pace to the cloud and 2) at the same time leverage their existing BW base in the cloud quickly.

There are some key guiding principles that the SAP DSP Bridge solution embodies:

  • Reuse. Reduce, reuse, recycle!  SAP has recognized that redoing work that has already been done is not a fan favorite.  After all, there was a lot of effort put into carefully crafting all the current SAP BW and SAP BW/4HANA data warehouses out there. 
  • Connect to data sources with confidence and in a familiar manner.
  • Innovate! Leverage the benefits of the cloud to innovate sooner rather than later with our existing SAP BW assets.

What the Bridge Does

The SAP BW Bridge transfers key elements of an existing BW environment into a custom space inside SAP DSP so departments can share access to critical data.  With SAP BW Bridge, key content, data, staging, customization and connectivity is transferred to a purpose-built space inside of data warehouse cloud, where it can now be leveraged by other data users as if it was any other data space inside of the DSP environment.

  • Reuse, not rebuild data models, transformations; and customizations to protect investments
  • Accelerate time-to-value with 70-80% reuse of existing BW artifacts with transfer tools
  • Capitalize on your existing expertise with access to a familiar modeling and development environment

Unlike other cloud solutions, this preserves the use of most customizations and custom data objects from BW.

What the Bridge Enables

Once the bridge to the DSP is enabled for your BW solution, you gain new abilities to work with your data assets including:

  • Retain familiar connectivity to SAP data and semantics efficiently with ABAP-level extractors, staging area and understanding of SAP data and relationships 
  • Extend your data reach easily to new data sources and take advantage of the Data Marketplace to combine SAP and external data for broader insights
  • Connect data efficiently across clouds and hybrid landscapes without unnecessary data movement – unmatched data virtualization across multiple clouds

This makes it easier to transition your workflows to leverage the power of new technologies such as SAP’s upcoming Data Marketplace.

To summarize, SAP BW Bridge allows you to retain much of the power of your original BW environment inside SAP DSP quickly.  You can start reaping the benefits of the DSP cloud platform even before fully migrating to it.  The bridge tool allows you to chart your own journey and timeline to migrate to the cloud without forcing you into a big bang cutover.

This tool will help us all in our mission to breakdown business silos and empower users with the latest information, all running on the proven HANA database management system, designed specifically to take on today’s most challenging, multi-model analytics problems. 

With SAP BW Bridge, you gain the power of bringing your systems together as part of SAP’s Business Technology Platform. This powerful platform was engineered by SAP not only to meet the critical needs of today’s processing but to grow with you to meet your business’s challenges for years to come. 

If you’d like to know more or would like a bit of help charting your journey with the SAP BW Bridge and SAP DSP, we’d love to help.  Contact us using the form below.

– By Merri Beckfield

Business Objects Move to Hybrid Cloud

Starting Your Journey to Business Objects Cloud

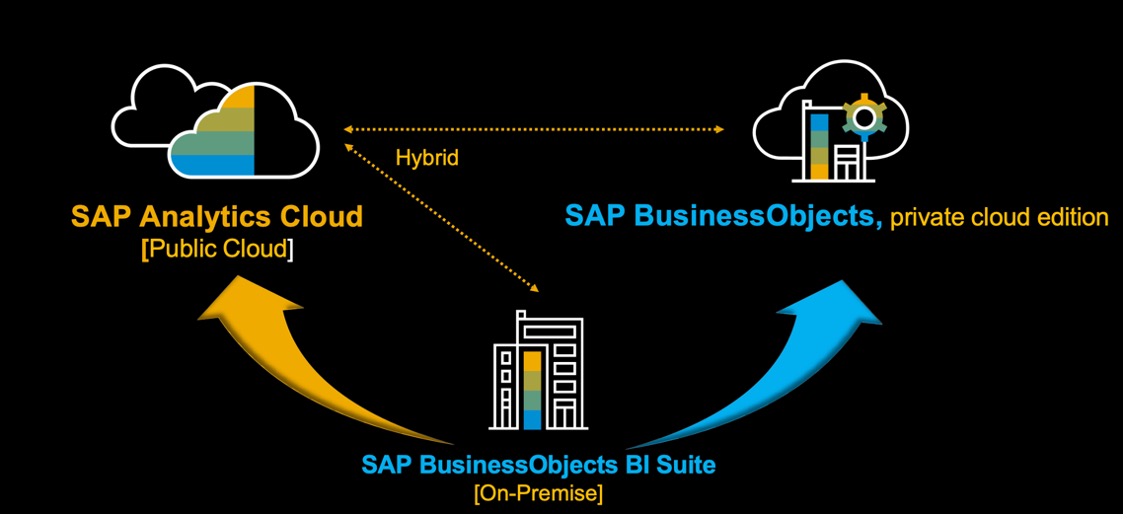
Today many organizations rely on business intelligence and run multiple BI platforms that address different business needs. With cloud-based BI tools coming into vogue, Business Objects and other products, like Tableau, Power BI, and QlikView, are at a crossroads. With SAP’s future road map retiring the Business Objects on-prem licensing model, it is critical to ensure the IT roadmap has a solid strategy for addressing this situation.

Recognizing that the future is digitization, SAP is pursuing a strategy of delivering an entire business analytics platform in the cloud. Although SAP has pledged Priority 1 support for BOBJ SP4.3 through the year 2027, the future investment will focus on SAP Analytics Cloud.

For many organizations, no other product can easily replace Business Objects.  The universe model is secure, convenient, scalable, and the foundation on which the reporting structure is built.  Redeploying all this from the ground up directly into SAP Analytics Cloud can be a massive undertaking.  The thought of moving “big bang” from BOBJ to another tool can be a significant barrier to progress to an analytics cloud platform.  There is another way.

Consider a move to a hybrid cloud-based model consisting of SAP Business Objects private cloud edition paired with SAP Analytic Cloud.  This allows you to take advantage of the benefits of the cloud while retaining access to universes and moving content to SAC when and where it makes sense.

For many organizations, BOBJ is an invaluable asset. The adage, “if it isn’t broke, don’t fix it” applies. The continued loyalty of customers depends on the SAP’s continued commitment to Business Objects.

LOOKING TO THE FUTURE AND BUILDING ON THE PAST:  We have extensive knowledge of the Business Intelligence ecosystem and can say with certainty that the landscape is changing.

To stay on top, organizations should leverage their assets by opening up to hybrid options and other BI analytics tools. In this scenario, rather than being replaced by other BI tools, Business Objects will remain the foundation and create new growth opportunities.

Tek Analytics can help you evaluate the hybrid strategy of Business Objects Private Cloud Edition and SAC.  This can allow you to shift on-premise workloads to a managed cloud environment that will continue to evolve and be supported beyond 2027.    Contact Us today to learn more!

Contact TEK – Tek Digital Transformations (tek-analytics.com)

– By Merri Beckfield

Recycling of Data: Taming the Data Deluge

Reduce reuse

Recycling Of Data: Taming The Data Deluge

Reducing, Reusing, and Recycling your data to get it under control


Many of us have heard the phrase “Reduce, Reuse, Recycle” for many years.  When hearing that phrase, it conjures up images of plastic water bottles, milk jugs, and soda cans.   Have you ever stopped to think of how these three words could be applied to the never-ending flood of data sources in our organizations? 


As many of us can attest, our data houses are becoming messy, and the stuff is piling up.   Our teams are getting overwhelmed in trying to deal with the deluge.  The refrains of “we have the data, but we can’t find it” Or “It is like looking for a needle in a haystack” are becoming all too common.


According to a recent report by Seagate1, they project a 42.2% annual growth rate of enterprise data over the next two years.  The data deluge is an issue for organizations today that threatens to become a serious risk in the future if not addressed.  Our data houses are chaotic, and it is difficult to know where to start to get it under control.


Here is where concepts borrowed from recycling can help:


  • Recycle – Recycle the tried-and-true techniques for organizing and managing work.  Dealing with data, while considered a bit esoteric, is just another type of work.  Get the work identified, prioritized (or de-prioritized if appropriate), and scheduled on a roadmap. 

  • Reduce – Reduce the amount of data sources used in your organization. Not all sources are created equal. Identify which sources are both relevant and reliable.  Eliminate the clutter and noise from the others.

  • Reuse – Investigate methods to share data knowledge. It is amazing how something as simple as a bi-weekly “birds-of-a-feather” sharing session across the key analysts in the organization can help with this.  Promote collaboration and sharing amongst the data analysts in your organization.  A bit of time invested up-front can pay off big-time in reduced rework.


If you’d like help in taming the data deluge, we can help.  Our resources have techniques that can assist you in Reducing, Reusing, and Recycling your data to get it under control.  Contact TEK – Tek Digital Transformations (tek-analytics.com)


1 Rethink Data | Seagate US


– By Merri Beckfield

Schedule Publications for your Stories and Analytics applications in SAP Analytics Cloud

Schedule Publications For Your Stories and Analytics Applications in SAP Analytics Cloud

SAP Analytics Cloud is introducing one of the most asked features on Scheduling Stories and Analytical Applications with its latest update 2020.03.

We call it as Schedule Publications. With this, you would be able to Schedule a Story and also an analytical application with recurrence and distribute the same as a PDF over email to a number of different SAC and Non-SAC recipients. And do much more things like, you can even include a customized message in the email per the schedule and attach a link as well to the view of the story in online mode which can be used to check the latest online copy of the story / analytical applications.

Note: Schedule publications would be available only for SAP Analytics cloud Tenants based on the AWS data center (Cloud foundry based).

You can create a single schedule or even a recurring one with a defined frequency like hourly, daily, weekly.

Let’s get started:

At first, Schedule Publications needs to be enabled by your organization SAP Analytics cloud admin on the Tenant level. To do the same, please log in as Admin and go to System -> Administration and enable the Toggle as shown below.

Allow Schedule Publications” and “Allow Schedule Publication to non-SAC users

If you want to allow your schedules to be sent over to Non-SAC users as well along with SAC users, Please enable the toggle option as shown below.

Schedule Publications is not by default enabled   to all users in your organization, your admin needs to assign to a template who would have rights for creating schedules.  To do the same. under the SAC Tenant application menu. Go under the Security -> Roles and click on any existing role where you would like to add Schedule Publications right.

How to create Schedule Publications?

You can create a schedule IF

  • If you are a BI Admin or an Admin. By default, these roles come with the Schedule Publication permission.
  • If the Schedule Publication permission has been assigned to a custom role created.
  • If you have a Save or Save As permission to a story once the Schedule Publication permission is given.

Once a user has been granted access to create schedules

  • Select the Story / Analytical application under the browse files (By using the checkmark) and then choose the option Share  -> Schedule Publications as shown below or

  • The other way is to open a Story and the again go under share option and select Schedule Publication.

  • Once the Schedule Publications Dialog box opens, Input the details as required.

Name: Provide a name for your Schedule

Start:  Provide a start date for your schedule with a defined time or you can add recurrence

details as well by selecting the option “Add Recurrence”.

Under Recurrence, you can define the recurrence pattern to be hourly, daily, weekly as different options and also the number of times needs to be repeated including the end of occurrence details.

Topic: This is the subject for the email which would be delivered to the recipients

Message: This is the body of the message for the email which would be sent to the recipients over email.

Include Story Link:  If you select this checkmark, then the story/ analytics application link would be sent along with the email. If you happen to personalize the publication by selecting a bookmark to be delivered (Given below), then the personalized bookmark view link would be embedded.

Distribution: Here you can define the view of the story which needs to be delivered to the recipients. You can personalize different users or teams with different views of the same story to be delivered with the help of bookmarks available for stories. If your stories have multiple bookmarks where each of the bookmarks are relevant for different users/teams, you can make use of the same, else create one. The advantage you find with the bookmarks is you can create a unique personalized view by applying different filter options and create views. 

Distribution (Continued): You can create one or more than view (as story default view or different bookmarks) which can be delivered to different SAC users/teams. Let’s focus on one view and understand all options. Next to the Down-arrow, Double click “View1” and provide a name for your view. Below screenshot describes to be “Corona virus Clinical Characteristics Report”.

  • SAP Analytics Cloud Recipients: Click the person icon and select the different SAC user recipients or teams
  • Non-SAP Analytics Cloud Recipients: These are the users who are not a part of SAC user lists or a part of SAC tenant. You can include their email address by manually typing their addresses. Under the default SAC Analytics Cloud licensing, Per View, you can input a maximum of 3 Non-SAC Recipients.
  • Story View: Choose the Story/Bookmarks view which you want to deliver to the above recipients. You can choose between Original Story, Global Bookmarks and as well My Bookmarks. the authorization on the story publication would be same as schedule owner and the exact view would be delivered to different recipients.
  • File Name: Name of the publication which would be delivered to the recipients
  • PDF Settings: You can select this option to define the PDF settings like what all pages you want to deliver, the grid settings for different columns and rows selection, choose to insert appendix which has details on metadata information on the story.

Once you are done with all the details then, Click OK and create your Schedule.

How to view my Schedules created and as well how can I Modify the Schedule?

You can view the Schedule created under the Calendar view. Go to the SAC application menu and select Calendar. You can see the schedule created right there.

If its recurrence schedule, then you would see against multiple different dates /time as defined by the schedule owner.

You can as well modify a single recurrence or the entire series occurrence. Select the occurrence from the calendar view and on your right side, a new panel opens where you can modify as shown below.

You can edit the Referrence Setting for Reference Pattern and End Reference by as interested and click on OK and click on Update to save the changes.


As and when the clock ticks it’s time, The Schedule publication picks the job and creates the publications and send it to the different recipients defined as an attachment over email. The maximum mail delivery size allowed per email including attachment is 15MB.

Schedule Publications in itself is a resource intensive tasks which includes the Schedule publications engine on the cloud hosted on SAP Analytics Cloud do a variety of jobs in the background for creating the publications including the email delivery. Out of the box with the standard licensing you would get limited number of schedules.

Need additional assistance? Contact us today!