Analytics 101: Understanding the Basics and Importance of Analytics

Analytics 101: Understanding the Basics and Importance of Analytics

Welcome to the world of analytics – where data becomes insights and decision-making becomes more informed. Analytics is the process of using data to gain insights and make informed decisions. In today’s data-driven world, analytics is becoming increasingly essential for businesses of all sizes and industries. In this article, we will explore the basics of analytics and its importance in the modern business landscape.

What is Analytics?

Analytics is the process of collecting, storing, and analyzing data to identify patterns, relationships, and trends that can inform decision-making. Analytics can help businesses uncover insights that they might not have otherwise seen, and make data-driven decisions that are based on facts and figures rather than gut feelings or intuition.

Types of Analytics

There are several types of analytics, including:

Descriptive analytics: This type of analytics describes what has happened in the past. It involves collecting and analyzing historical data to identify patterns and trends.
Diagnostic analytics: This type of analytics explains why something happened. It involves analyzing data to understand the root cause of a problem or opportunity.
Predictive analytics: This type of analytics predicts what will happen in the future. It involves using statistical models and machine learning algorithms to forecast future trends and behaviors.
Prescriptive analytics: This type of analytics recommends what actions to take. It involves using data and models to identify the best course of action to achieve a specific goal.

Importance of Analytics

Analytics can be applied in various industries, such as finance, healthcare, marketing, and sports. It can help businesses improve their efficiency, reduce costs, and increase revenue. Analytics allows businesses to:

Gain insights: Analytics provides businesses with insights that they might not have otherwise seen, which can help them make informed decisions.
Identify opportunities: Analytics can help businesses identify new opportunities that they might not have otherwise seen, such as new markets or products.
Make data-driven decisions: By using analytics, businesses can make data-driven decisions that are based on facts and figures rather than gut feelings or intuition.
Improve efficiency: Analytics can help businesses identify areas where they can improve their efficiency and reduce costs.
Increase revenue: By identifying new opportunities and making data-driven decisions, businesses can increase revenue and gain a competitive advantage in their industry.

Conclusion

In conclusion, analytics is a powerful tool that can help businesses make data-driven decisions and gain a competitive advantage in their industry. By leveraging analytics, organizations can gain insights, identify opportunities, and make informed decisions that improve their performance. If you’re interested in leveraging the power of analytics for your business, consider partnering with a team of experts who can help you collect, store, and analyze data effectively. Contact us today to learn more!

The SAP DWC Bridge: Easing the Journey to the Cloud for SAP BW Customers

The SAP Datasphere BW Bridge: Easing the Journey to the Cloud for SAP BW Customers

If you have an existing SAP BW or BW/4HANA on premise data warehouse, you are likely well aware that it didn’t just appear overnight fully loaded with data and analytics solutions but rather was developed with lots of thought, care, and attention.  With the advent of all things cloud, including data warehouses, what does it mean to all the accretive knowledge, business logic, and code that is encompassed in our existing solutions?

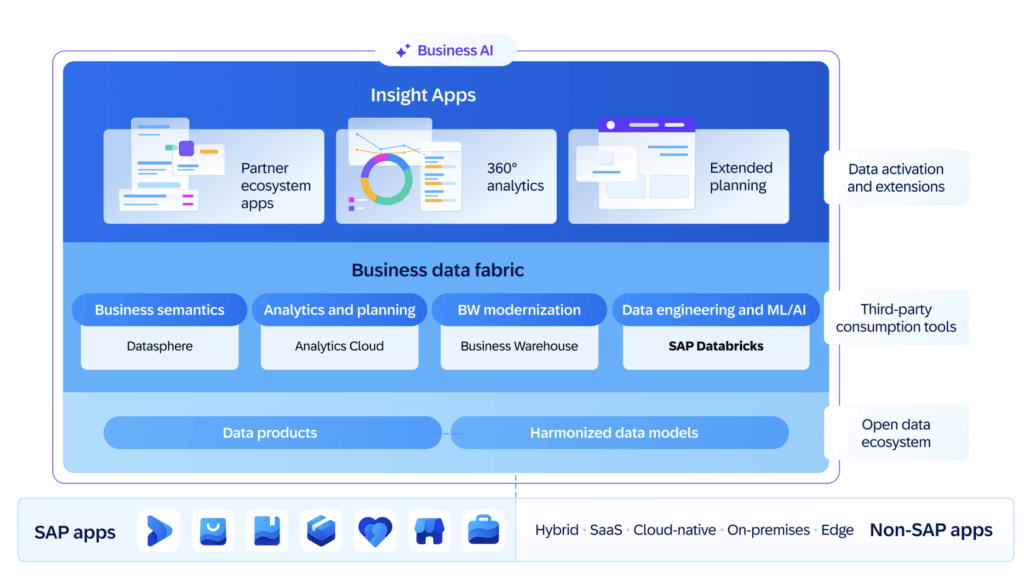
With the marketing and media attention on the cloud, we are bombarded with all the benefits that a cloud solution can bring.   SAP has delivered a top-notch, long-term cloud data warehouse and analytics solution set in SAP Datasphere (SAP DSP) and SAP Analytics Cloud (SAP SAC).  This solution set provides a business focused, innovative, and fully cloud based BI solution.  SAP DWC is the strategic, target solution for all data warehouse uses in SAPs statement of direction. And while that all sounds like a wonderful panacea, it can be a bit daunting to think about how to get from point a (our on-prem solution) to point b (a cloud DW solution).

The Bridge Concept

Fortunately, SAP has come up with a practical and innovative solution to make it much easier for their customers to start their cloud journey to the SAP DSP solution:  the SAP DSP Bridge.   At the heart of it, the bridge is a tool that customers can leverage to 1) move at their own pace to the cloud and 2) at the same time leverage their existing BW base in the cloud quickly.

There are some key guiding principles that the SAP DSP Bridge solution embodies:

  • Reuse. Reduce, reuse, recycle!  SAP has recognized that redoing work that has already been done is not a fan favorite.  After all, there was a lot of effort put into carefully crafting all the current SAP BW and SAP BW/4HANA data warehouses out there. 
  • Connect to data sources with confidence and in a familiar manner.
  • Innovate! Leverage the benefits of the cloud to innovate sooner rather than later with our existing SAP BW assets.

What the Bridge Does

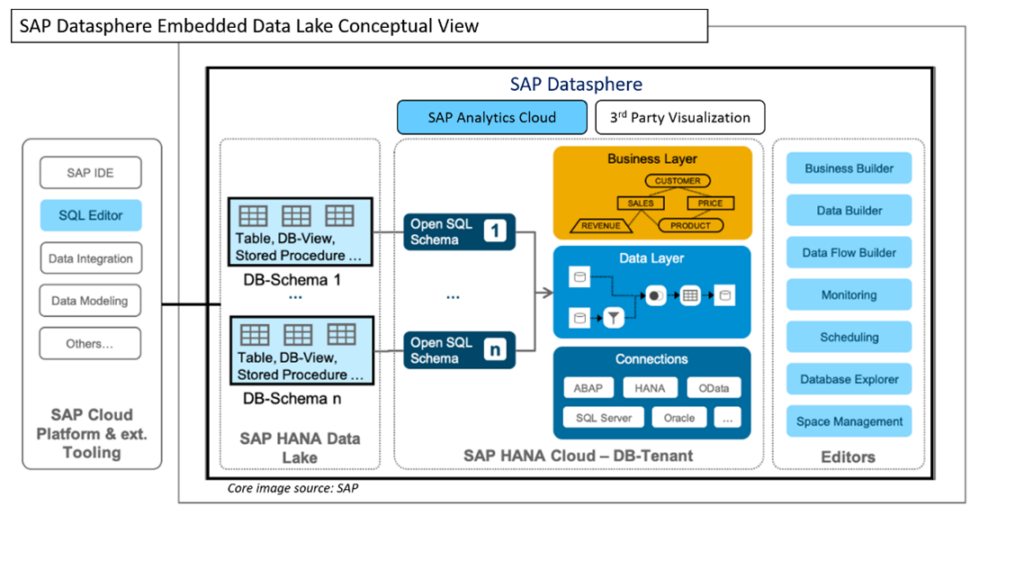
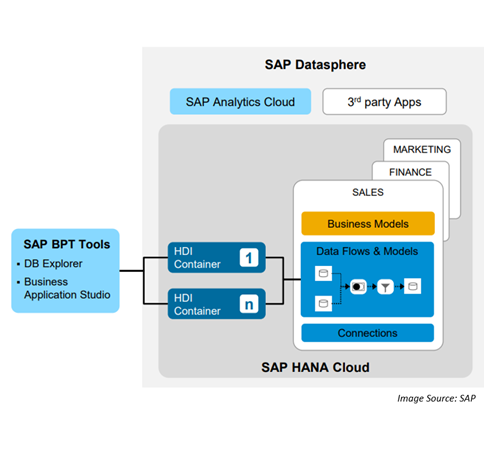
The SAP BW Bridge transfers key elements of an existing BW environment into a custom space inside SAP DSP so departments can share access to critical data.  With SAP BW Bridge, key content, data, staging, customization and connectivity is transferred to a purpose-built space inside of data warehouse cloud, where it can now be leveraged by other data users as if it was any other data space inside of the DSP environment.

  • Reuse, not rebuild data models, transformations; and customizations to protect investments
  • Accelerate time-to-value with 70-80% reuse of existing BW artifacts with transfer tools
  • Capitalize on your existing expertise with access to a familiar modeling and development environment

Unlike other cloud solutions, this preserves the use of most customizations and custom data objects from BW.

What the Bridge Enables

Once the bridge to the DSP is enabled for your BW solution, you gain new abilities to work with your data assets including:

  • Retain familiar connectivity to SAP data and semantics efficiently with ABAP-level extractors, staging area and understanding of SAP data and relationships 
  • Extend your data reach easily to new data sources and take advantage of the Data Marketplace to combine SAP and external data for broader insights
  • Connect data efficiently across clouds and hybrid landscapes without unnecessary data movement – unmatched data virtualization across multiple clouds

This makes it easier to transition your workflows to leverage the power of new technologies such as SAP’s upcoming Data Marketplace.

To summarize, SAP BW Bridge allows you to retain much of the power of your original BW environment inside SAP DSP quickly.  You can start reaping the benefits of the DSP cloud platform even before fully migrating to it.  The bridge tool allows you to chart your own journey and timeline to migrate to the cloud without forcing you into a big bang cutover.

This tool will help us all in our mission to breakdown business silos and empower users with the latest information, all running on the proven HANA database management system, designed specifically to take on today’s most challenging, multi-model analytics problems. 

With SAP BW Bridge, you gain the power of bringing your systems together as part of SAP’s Business Technology Platform. This powerful platform was engineered by SAP not only to meet the critical needs of today’s processing but to grow with you to meet your business’s challenges for years to come. 

If you’d like to know more or would like a bit of help charting your journey with the SAP BW Bridge and SAP DSP, we’d love to help.  Contact us using the form below.

– By Merri Beckfield

Business Objects Move to Hybrid Cloud

Starting Your Journey to Business Objects Cloud

Today many organizations rely on business intelligence and run multiple BI platforms that address different business needs. With cloud-based BI tools coming into vogue, Business Objects and other products, like Tableau, Power BI, and QlikView, are at a crossroads. With SAP’s future road map retiring the Business Objects on-prem licensing model, it is critical to ensure the IT roadmap has a solid strategy for addressing this situation.

Recognizing that the future is digitization, SAP is pursuing a strategy of delivering an entire business analytics platform in the cloud. Although SAP has pledged Priority 1 support for BOBJ SP4.3 through the year 2027, the future investment will focus on SAP Analytics Cloud.

For many organizations, no other product can easily replace Business Objects.  The universe model is secure, convenient, scalable, and the foundation on which the reporting structure is built.  Redeploying all this from the ground up directly into SAP Analytics Cloud can be a massive undertaking.  The thought of moving “big bang” from BOBJ to another tool can be a significant barrier to progress to an analytics cloud platform.  There is another way.

Consider a move to a hybrid cloud-based model consisting of SAP Business Objects private cloud edition paired with SAP Analytic Cloud.  This allows you to take advantage of the benefits of the cloud while retaining access to universes and moving content to SAC when and where it makes sense.

For many organizations, BOBJ is an invaluable asset. The adage, “if it isn’t broke, don’t fix it” applies. The continued loyalty of customers depends on the SAP’s continued commitment to Business Objects.

LOOKING TO THE FUTURE AND BUILDING ON THE PAST:  We have extensive knowledge of the Business Intelligence ecosystem and can say with certainty that the landscape is changing.

To stay on top, organizations should leverage their assets by opening up to hybrid options and other BI analytics tools. In this scenario, rather than being replaced by other BI tools, Business Objects will remain the foundation and create new growth opportunities.

Tek Analytics can help you evaluate the hybrid strategy of Business Objects Private Cloud Edition and SAC.  This can allow you to shift on-premise workloads to a managed cloud environment that will continue to evolve and be supported beyond 2027.    Contact Us today to learn more!

Contact TEK – Tek Digital Transformations (tek-analytics.com)

– By Merri Beckfield

Recycling of Data: Taming the Data Deluge

Reduce reuse

Recycling Of Data: Taming The Data Deluge

Reducing, Reusing, and Recycling your data to get it under control


Many of us have heard the phrase “Reduce, Reuse, Recycle” for many years.  When hearing that phrase, it conjures up images of plastic water bottles, milk jugs, and soda cans.   Have you ever stopped to think of how these three words could be applied to the never-ending flood of data sources in our organizations? 


As many of us can attest, our data houses are becoming messy, and the stuff is piling up.   Our teams are getting overwhelmed in trying to deal with the deluge.  The refrains of “we have the data, but we can’t find it” Or “It is like looking for a needle in a haystack” are becoming all too common.


According to a recent report by Seagate1, they project a 42.2% annual growth rate of enterprise data over the next two years.  The data deluge is an issue for organizations today that threatens to become a serious risk in the future if not addressed.  Our data houses are chaotic, and it is difficult to know where to start to get it under control.


Here is where concepts borrowed from recycling can help:


  • Recycle – Recycle the tried-and-true techniques for organizing and managing work.  Dealing with data, while considered a bit esoteric, is just another type of work.  Get the work identified, prioritized (or de-prioritized if appropriate), and scheduled on a roadmap. 

  • Reduce – Reduce the amount of data sources used in your organization. Not all sources are created equal. Identify which sources are both relevant and reliable.  Eliminate the clutter and noise from the others.

  • Reuse – Investigate methods to share data knowledge. It is amazing how something as simple as a bi-weekly “birds-of-a-feather” sharing session across the key analysts in the organization can help with this.  Promote collaboration and sharing amongst the data analysts in your organization.  A bit of time invested up-front can pay off big-time in reduced rework.


If you’d like help in taming the data deluge, we can help.  Our resources have techniques that can assist you in Reducing, Reusing, and Recycling your data to get it under control.  Contact TEK – Tek Digital Transformations (tek-analytics.com)


1 Rethink Data | Seagate US


– By Merri Beckfield

Predictive Scenario on Regression

Predictive Scenario On Classification.

Smart Predict is an Augmented Analytics feature in SAP Analytics Cloud that helps you generate predictions about future events, values, and trends.

The predictive experience in SAP Analytics Cloud is simple. Smart Predict guides you step by step to create a predictive model based on historical data. The resulting model can be used to make trusted future predictions, providing you with advanced insights to guide decision-making.

Smart Predict accelerates the prediction and recommendation creation process by focusing on business outcomes.

Before using Smart Predict for the first time, it really helps to understand a few basic concepts of predictive modeling. So, here they are!

The different types of predictive scenarios

There are currently 3 types of predictive scenarios available in Smart Predict:

  • Classification
  • Regression
  • Time Series

Defining the business problem or business question you want to address will help you choose the right type of predictive scenario.

Classification Scenario: If you’re trying to determine the likelihood of whether something will happen, you’re dealing with a classification scenario.

Ex: You want to predict membership of categories such as Yes/NO, Customer is likely to churn or not, replacing intervals within short or long for the manufacturing process, Binary (0 or 1).

Regression Scenario: If you’re trying to predict a numerical value and explore the key drivers behind it, you’re dealing with a regression scenario. 

Ex: Predict the price of an imported product based on projected transport charges and tax duties.

 Time Series Scenario: If you’re trying to forecast a future numerical value based on fluctuations over time, seasons, and other internal and external variables, you’re dealing with a time series scenario.


Predictive Scenario based on Regression:

Step 1. Loading the data

• Before we load the dataset into SAC, we cut out a few records from the original dataset. We will use this to apply our model later. I cut out 20 records of each wines from the dataset for red and white wines, each to use later. Now I have 4 datasets as follows.

A.         1580 red wines for training

B.         20 red wines for prediction

C.        4879 white wines for training

D.        20 white wines for prediction

At first create a folder in your files to save all the files at one place.

Inside your newly created folder, create a new dataset by clicking ‘+’ icon → Dataset .

Now you will be asked how you would like to begin – load data from a local file or from a data source. Since we have data in csv files, click on local data source. Select your source file. Load all 4 datasets. Your folder should look like the last screenshot.


Step 2. Training the model

  1. Let us now build the predictive scenario. This is where our models to predict wine quality will be built and trained. On the main menu, click on Create >> Predictive Scenario.
  2. For this problem, our predicted entity is an integer between 0 to 10. So, we will build a regression model. Select regression, give the scenario a suitable name and description.

In the Predictive Scenarios page click on ‘+’ to add a scenario.

Select a scenario that best suits to your analytic dataset.

Fill the details and click on OK.

Select the Input Dataset as show below.

  • If you want edit the edit metadata, Click on Edit variable metadata (under the input dataset field) to understand how SAC has interpreted the dataset, what is the storage and type of each of the variables, what should SAC do with missing values, is the variable the key of the dataset, etc.

  • We now need to define the variable we wish to predict. In our case this is quality of the wine, so click on Target and select quality.

  • If there are variables in the dataset, you would like to exclude from modelling, declare them here as show below. This helps to Improve the results.

  • Now that SAC knows what it needs to do, we can get started with training. Click on Train at the bottom.

SAC will take a while to train with the data set, and identify the best model for this problem statement. Then you now have results of your model as shown below.


Step 3. Understanding the results

  • After you click on Train, and SAC completes the training process, it will show you 2 tabs of information.
  • Overview tells you about the quality of the results
  • In our cases it is 99% confident about its results.
  • It also says that the error is 0.8. This means that the true value is ±0.8 from our prediction. 
  • The influencer contributions explain the results
  • Density of the wine and sugar understandably have the highest correlation with wine quality, followed by the other variables.

Step 4. Applying the model

  • Now that our model is ready, we can apply it on the dataset we had carved out earlier.
  • Click on the apply model option (icon at far right).


  • At Input Dataset Variables selects the variables that you would like to see in the output.

  • Fill all the details as shown below and click on Ok.

  • Then go to the folder to check the predicted model and click on the model. You can see, in the predictions file, see the column at far right called Predicted Value.

Repeat the same steps to know the quality of the Red wine.

  • I found the model for red wines had an error of 0.69 with a confidence of 95%. Alcohol seems to be the dominant predictor.
  • I can see both my models in the predictive model’s section at the bottom. I can see status of models (trained / applied).

Create a model based on the Output Dataset of the Predictive Scenario.

Click on Menu → Create→ Model→ Click on Get data from datasource and in the Acquire Data select Dataset.

  • Select the Dataset.

  • Click on the Create Model on the bottom.

Or You Can directly create a story on Dataset.

Go to Create → Click on Story

  • Click on Access & Explore Data as shown below.

  • Click on Datasource and click on the Dataset as shown below.


  • Select the Dataset.

  • Click on the Story and start creating story.


Need additional assistance? Contact us today!

Schedule Publications for your Stories and Analytics applications in SAP Analytics Cloud

Schedule Publications For Your Stories and Analytics Applications in SAP Analytics Cloud

SAP Analytics Cloud is introducing one of the most asked features on Scheduling Stories and Analytical Applications with its latest update 2020.03.

We call it as Schedule Publications. With this, you would be able to Schedule a Story and also an analytical application with recurrence and distribute the same as a PDF over email to a number of different SAC and Non-SAC recipients. And do much more things like, you can even include a customized message in the email per the schedule and attach a link as well to the view of the story in online mode which can be used to check the latest online copy of the story / analytical applications.

Note: Schedule publications would be available only for SAP Analytics cloud Tenants based on the AWS data center (Cloud foundry based).

You can create a single schedule or even a recurring one with a defined frequency like hourly, daily, weekly.

Let’s get started:

At first, Schedule Publications needs to be enabled by your organization SAP Analytics cloud admin on the Tenant level. To do the same, please log in as Admin and go to System -> Administration and enable the Toggle as shown below.

Allow Schedule Publications” and “Allow Schedule Publication to non-SAC users

If you want to allow your schedules to be sent over to Non-SAC users as well along with SAC users, Please enable the toggle option as shown below.

Schedule Publications is not by default enabled   to all users in your organization, your admin needs to assign to a template who would have rights for creating schedules.  To do the same. under the SAC Tenant application menu. Go under the Security -> Roles and click on any existing role where you would like to add Schedule Publications right.

How to create Schedule Publications?

You can create a schedule IF

  • If you are a BI Admin or an Admin. By default, these roles come with the Schedule Publication permission.
  • If the Schedule Publication permission has been assigned to a custom role created.
  • If you have a Save or Save As permission to a story once the Schedule Publication permission is given.

Once a user has been granted access to create schedules

  • Select the Story / Analytical application under the browse files (By using the checkmark) and then choose the option Share  -> Schedule Publications as shown below or

  • The other way is to open a Story and the again go under share option and select Schedule Publication.

  • Once the Schedule Publications Dialog box opens, Input the details as required.

Name: Provide a name for your Schedule

Start:  Provide a start date for your schedule with a defined time or you can add recurrence

details as well by selecting the option “Add Recurrence”.

Under Recurrence, you can define the recurrence pattern to be hourly, daily, weekly as different options and also the number of times needs to be repeated including the end of occurrence details.

Topic: This is the subject for the email which would be delivered to the recipients

Message: This is the body of the message for the email which would be sent to the recipients over email.

Include Story Link:  If you select this checkmark, then the story/ analytics application link would be sent along with the email. If you happen to personalize the publication by selecting a bookmark to be delivered (Given below), then the personalized bookmark view link would be embedded.

Distribution: Here you can define the view of the story which needs to be delivered to the recipients. You can personalize different users or teams with different views of the same story to be delivered with the help of bookmarks available for stories. If your stories have multiple bookmarks where each of the bookmarks are relevant for different users/teams, you can make use of the same, else create one. The advantage you find with the bookmarks is you can create a unique personalized view by applying different filter options and create views. 

Distribution (Continued): You can create one or more than view (as story default view or different bookmarks) which can be delivered to different SAC users/teams. Let’s focus on one view and understand all options. Next to the Down-arrow, Double click “View1” and provide a name for your view. Below screenshot describes to be “Corona virus Clinical Characteristics Report”.

  • SAP Analytics Cloud Recipients: Click the person icon and select the different SAC user recipients or teams
  • Non-SAP Analytics Cloud Recipients: These are the users who are not a part of SAC user lists or a part of SAC tenant. You can include their email address by manually typing their addresses. Under the default SAC Analytics Cloud licensing, Per View, you can input a maximum of 3 Non-SAC Recipients.
  • Story View: Choose the Story/Bookmarks view which you want to deliver to the above recipients. You can choose between Original Story, Global Bookmarks and as well My Bookmarks. the authorization on the story publication would be same as schedule owner and the exact view would be delivered to different recipients.
  • File Name: Name of the publication which would be delivered to the recipients
  • PDF Settings: You can select this option to define the PDF settings like what all pages you want to deliver, the grid settings for different columns and rows selection, choose to insert appendix which has details on metadata information on the story.

Once you are done with all the details then, Click OK and create your Schedule.

How to view my Schedules created and as well how can I Modify the Schedule?

You can view the Schedule created under the Calendar view. Go to the SAC application menu and select Calendar. You can see the schedule created right there.

If its recurrence schedule, then you would see against multiple different dates /time as defined by the schedule owner.

You can as well modify a single recurrence or the entire series occurrence. Select the occurrence from the calendar view and on your right side, a new panel opens where you can modify as shown below.

You can edit the Referrence Setting for Reference Pattern and End Reference by as interested and click on OK and click on Update to save the changes.


As and when the clock ticks it’s time, The Schedule publication picks the job and creates the publications and send it to the different recipients defined as an attachment over email. The maximum mail delivery size allowed per email including attachment is 15MB.

Schedule Publications in itself is a resource intensive tasks which includes the Schedule publications engine on the cloud hosted on SAP Analytics Cloud do a variety of jobs in the background for creating the publications including the email delivery. Out of the box with the standard licensing you would get limited number of schedules.

Need additional assistance? Contact us today!

Predictive Scenarios in SAP Analytics Cloud

Predictive Scenarios in SAP Analytics Cloud

Though predictive analytics has been around for decades, it’s a technology whose time has come. More and more organizations are turning to predictive analytics to increase their bottom line and competitive advantage. Why now?

With interactive and easy-to-use software becoming more prevalent, predictive analytics is no longer just the domain of mathematicians and statisticians. Business analysts and line-of-business experts are using these technologies as well.

The intent of this blog is to share my understanding and opinion of predictive capabilities and options available within the SAP Ecosystem.  Predictive Analytics in SAP can be leveraged with any of the below tools/applications. It all depends on how the  business adopt the tools.

SAP Analytics Cloud –

It’s a cloud-based SaaS offering from SAP, capable performing of BI, Planning, and Predictive/Augmented Analytics in one place. This tool offers out-of-the-box and business-friendly technology to perform predicative use cases. SAC uses HANA APL libraries (Classification, Regression, and Time-series Forecasting)… Models where you can input the historical data and predict future outcomes. Currently, it supports both flat-file and Live (HANA) connectivity. Live connections use On-prem HANA APL installation, not the SAC APL.

There are currently 3 types of predictive scenarios available in Smart Predict:

  • Classification
  • Regression
  • Time Series

To create and manage predictive scenarios in SAC you need a few different datasets:

  • The training dataset contains the historical data your predictive model will learn from. In this dataset, the values for your target variable, which is the column related to your business question, are known.
  • The application dataset contains current or new data that you would like to create predictions for. In this dataset, the values for the target variable are unknown.
  • The output dataset contains your predictions and any additional columns that you have requested. Once the Model is created, SAC has added advantage of publishing the model to S4 on-prem via Pai connections.

In the course of this blog, I will create a simple Predictive scenario of Insurance Fraud using SAC Smart Predict

SAP HANA –

As everyone knows, HANA is a powerful in-memory database from SAP. Predictive Capabilities in HANA are there for quite a while through Application Framework Libraries (AFL). Below are core predictive components of HANA predictive offerings:

PAL – Algorithmic approach towards machine learning and predictive use cases.  This is more suited for data scientists and IT people which requires SQL coding.

APL – Automated predictive libraries for augmented analytics to train and predict the outcome.

R/ EML Integration – Integrating with external R server for more robust and statistical use cases which requires CRAN algorithms and TensorFlow.

Check out the link for more information on HANA predictive (https://tek-analytics.com/site/blog_inner/28 )

SAP BW – Yes, SAP BW running on HANA has inbuilt Predictive algorithms. It uses Native HANA PAL libraries above using HAP for predictive modeling. This is best suited for industries with extensive in-house BW talent.

SAC Smart predict sample use case

Before we use the functionality, let’s look at the data we have

Data set 1 – Past insurance claims with the flag for fraud (Yes or No)

Data set 2 – Current insurance claims on which we apply the prediction

Step 1 – Create 2 datasets in SAC, Datasets can be Live on HANA tables or Flat files loaded into SAC

Step 2 – Create a Classification based Predictive scenario

Step 3 – Select Input Dataset, target variable and exclude the variables which have no impact on the outcome (Claim ID, Member name)

Step 4 – Train the Data set. After successful Training, SAC provides the output including Predictive power, Predictive confidence and we have an option to run Profit simulation to see where to concentrate

Applying the Model

Once we are comfortable with our Predictive Model, we can apply this to our new data set and see what it predicts

Provide, the new input dataset and Output to be created

The new dataset will be now created with the name provided. The new output dataset has two additional columns created with predictive class and Probability

This Dataset can be in turn used for creating stories for visualizations and also, we can write back to Hana for any additional use cases.

Need additional assistance? Contact us today!

Are you ready for SAP Analytics cloud Journey? My take on BOBJ to SAC Transition

Are You Ready for SAP Analytics Cloud Journey? My Take on BOBJ to SAC Transition

SAP Analytics Cloud is a next-gen cloud-based service offering for all reporting and analytical applications. As promoted by SAP it is the one-stop place for all the BI, Planning and Predictive applications. For years (Decades ????) Business Objects is a premium BI offering from SAP and customers are using it extensively and effectively.  With the new strategic direction of SAP, SAC is going to be a successor for all the reporting and analytical needs. Our customers frequently ask how can we migrate our on-prem BOBJ to SAC? What should be our strategy for cloud migration.

First, let’s see what SAC is and its capabilities are.

SAP analytics cloud is a next-generation all-in-one analytics SaaS solution that combines reporting planning as well as predictive.

Built natively on SAP HANA Cloud Platform (HCP), SAP Analytics Cloud allows data analysts and business decision-makers to visualize, plan and make predictions all from one secure, cloud-based environment. SAP claims this differs from other BI platforms, which often require data to be integrated from various sources and users to jump between different applications when performing tasks, such as creating reports. With all the data sources and analytics functions in one product, Analytics Cloud users can work more efficiently, according to SAP. The key functions are accessed from the same user interface that is designed for ease-of-use for business users.

SAP Business Objects BI suite –

Business Objects is a Premium BI offering from SAP with multiple BI suite of products bundled. This has been a very successful BI tool for most of the SAP customers. Even though SAP announced BI 4.3 and maintenance up to 2027, all new innovations will be added to SAC. The below Image shows the convergence plan for the products.

Let’s look at migration options from BOBJ to SAC. Unfortunately, at this moment there is no direct migration path or tools delivered by SAP. However, they are planning to deliver assessment tools for migration in the future to compare the features supported.  So, how can we start using the latest and greatest cloud offerings while we have thousands of BOBJ reports already deployed.

  • Let’s start with an assessment of the bobj system. SAP now changing the licensing model for BOBJ, if you are heavy Web-Intelligence shop and limited other tools, we now have Web-I only licensing so               we start using SAC for visualizations and planning
  • Latest BI 4.3 has very tighter integration with SAC which includes easy user onboarding and Web I data model connection
  • BOBJ 4.3 will have a new option to deploy Web I report directly to SAP Analytics Hub. This allows end-users transparency in accessing both SAC and BOBJ content
  • We already have universe connection available in SAC, so technically all the modeling/ semantics applied at Universe level can be used in SAC
  • BI 4.3 will be delivering a new Web I Data model, which essentially enables the user to build SAC stories on On-prem Web I
  • SAP Application designer will have all the features and capabilities of Lumira designer and now is the time to start converting (Again, no direct migration tool)

Tek Approach

  • Our Rapid Deployment team partners with IT and Business stakeholders and quickly identify the use-cases for On-prem, cloud and hybrid approaches
  • Our team will help customer to change the licensing model based on BI product usage for the effective and cost-efficient transition to SAC
  • Asses the On-prem BI platform and identify any redundant objects, identify reports which can be easily recreated in SAC
  • Configure Live, import connections and Deploy SAP Analytics Hub as reporting gateway for seamless and transparent SAC transition
  • Deploy SAC cloud content to Jumpstart the SAP Analytics cloud Journey
  • End to end training and enabling the business transition to Guided/Self – service BI using SAC

Need additional assistance? Contact us today!

Manage folder access in SAP Analytics Cloud

Manage folder access in SAP Analytics Cloud

SAP Analytics Cloud is a new generation cloud-based application that helps you explore your data, perform visualization and analysis, create financial plans, and produce predictive forecasting. you can restrict the folder access from individual user or teams (group of users). In SAP Analytics Cloud the authorization is mainly controlled by SAC role, SAP back-end system (e.g. S/4 HANA) and SAC folder access.

Note: you should have admin authorization to secure folder access in SAP Analytics Cloud.

below are the steps to restrict the folder access from a specific user or team.

Step 1: Log into SAP Analytics Cloud tenant URL with valid credentials

Step 2: Then click on the three horizontal stripe button(Main Menu), on top of the left corner on the home page.

Step 3: Click on Browse>Files


Step 4: Click on the Public folder. Here we doing the restriction settings on subfolders of the Public folder. If you want to put a restriction on another folder of the public folder follow the same steps.


Step 5: Select the folder where you want to put a restriction and then click on the manage button(here we are putting restrictions on subfolders of Rumpke Reporting). 


Step 6: Click on the Sharing Settings which can be available under the Manage button.

Step 7: Here you can set the required restriction on teams or users.


Note: You can share the restricted folder with all users.

Step 8: You need to give access to the required user or team.

There are different types of access available.

View: In view access, the restricted user can read and copy the folder but he can not make any changes.

Edit: In edit access the restricted user can  Update the folder,  create files, create folders and maintain the folder.

Custom: In custom access, we have different options, You need to check the required access you want to provide to users or team.

Full control: In full control access the restricted user can delete the folder and share the folder to different users or teams.

Note: In SAP Analytics Cloud, you can create new roles to different users (follow the below steps for new roles creation)

Creating a New Role

In the Main Menu Go to Security>Roles

In Security/Role page Click on + Create a new role Option under Custom roles

Enter the details of new role which you want to create and click on create button


The new role will be added under the custom roles.

After selecting the appropriate access Then click on  Add Users and Teams button. Here you can see the available list of users or teams.

Step 9: select users or teams by clicking on Add Users or Teams Option

Select the users or teams and click ok button

Step 10: Folder security settings based on the folder structure and team structure. Folder restriction along with the role assigned to the users/team, you can control the access in the SAC application. Then click on the Share button.


Need additional assistance? Contact us today!

SAP Analytics Cloud latest features 2019.13

SAP Analytics Cloud latest features 2019.13

This blog covers some of the latest new features and enhancements in SAP Analytics Cloud release 2019.13.
Administration:
  • Administrators can now restrict who can create files and folders within dedicated subfolders of the Public folder. These users still won’t be able to create files and folders directly within the Public folder itself.
  • Administrators can audit changes made to files’ sharing settings

These include:

  1. The name of the object whose permissions were changed
  2. The permissions that were granted/revoked and to which specific user/team
  3. The user who made the change
  4. The timestamp of the change

Note: The Activities log is now updated to show details for any changes that are made to the Sharing Settings of files stored under Browse > Files.   
                            

Stories

  • You can now add or delete comments without saving your story.
  • When data labels in your bar charts overlap, you can now prioritize the bars in visualization to show the front bar’s data labels only, making it easier to view your information.


  • You can now use Search to Insight to search within live BW and S/4 HANA data models. You can choose a model and search for insights and can also create charts.


Planning

  • In the calendar, you can now see if processes are related to each other or if they just happen to start at the same time. Also, in the Gantt view, you can now see the time values changing when you drag and drop a process.


  • You can now set up a context for a Calendar task, defining all the relevant information for the task such as the Model, primary or Driving dimension, and assignees and reviewers.


  • When you copy an aggregated account with calculated subaccounts, you can now see additional targets highlighted so you can paste the account value and its underlying records.


Analytics Designer

  • As an application designer, you can now add geo map widgets to your analytic application and allow your application users to create stories from the widgets. Currently, geo map widgets don’t support data source-related APIs. Support for this is planned for future waves.


  • Analytics Designer introduces a concept of names for widgets and other application entities to ease the handling effort at design time.

If you as an application designer want to rename some entity, various references to it must be adapted (mainly scripts, dynamic texts, and calculated measures). Previously, you had to do this work manually.

The new automatic refactoring automates this process as much as possible.

  • You can now add a Search to Insight object to the scripting area and design its open dialog by defining the source of the questions to be asked. You can also specify whether the dialog is in simple mode or advanced mode and if you want to enable Clean History and Auto Search. Simple Dialog Mode, Advanced Dialog Mode are shown below.


  • You can now use the BPC Planning Sequence widget to run planning sequences for BPC live data connection models. This way, the application user can run a planning sequence, which can contain one or more planning functions, as defined in the BPC system.